USDJPY Technical Analysis – February 26, 2025
Market Overview
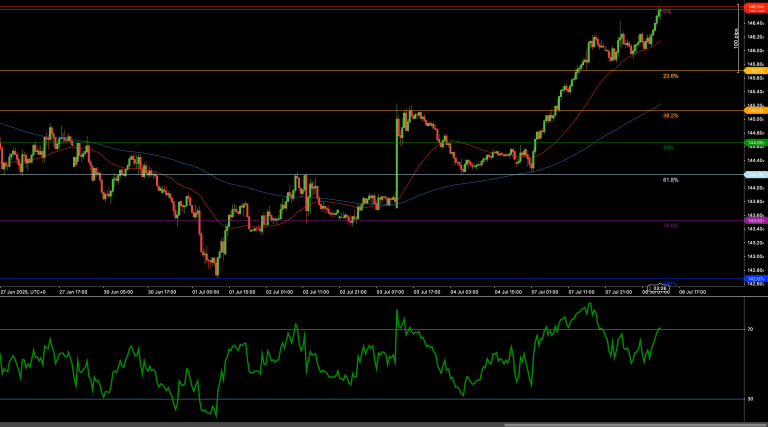
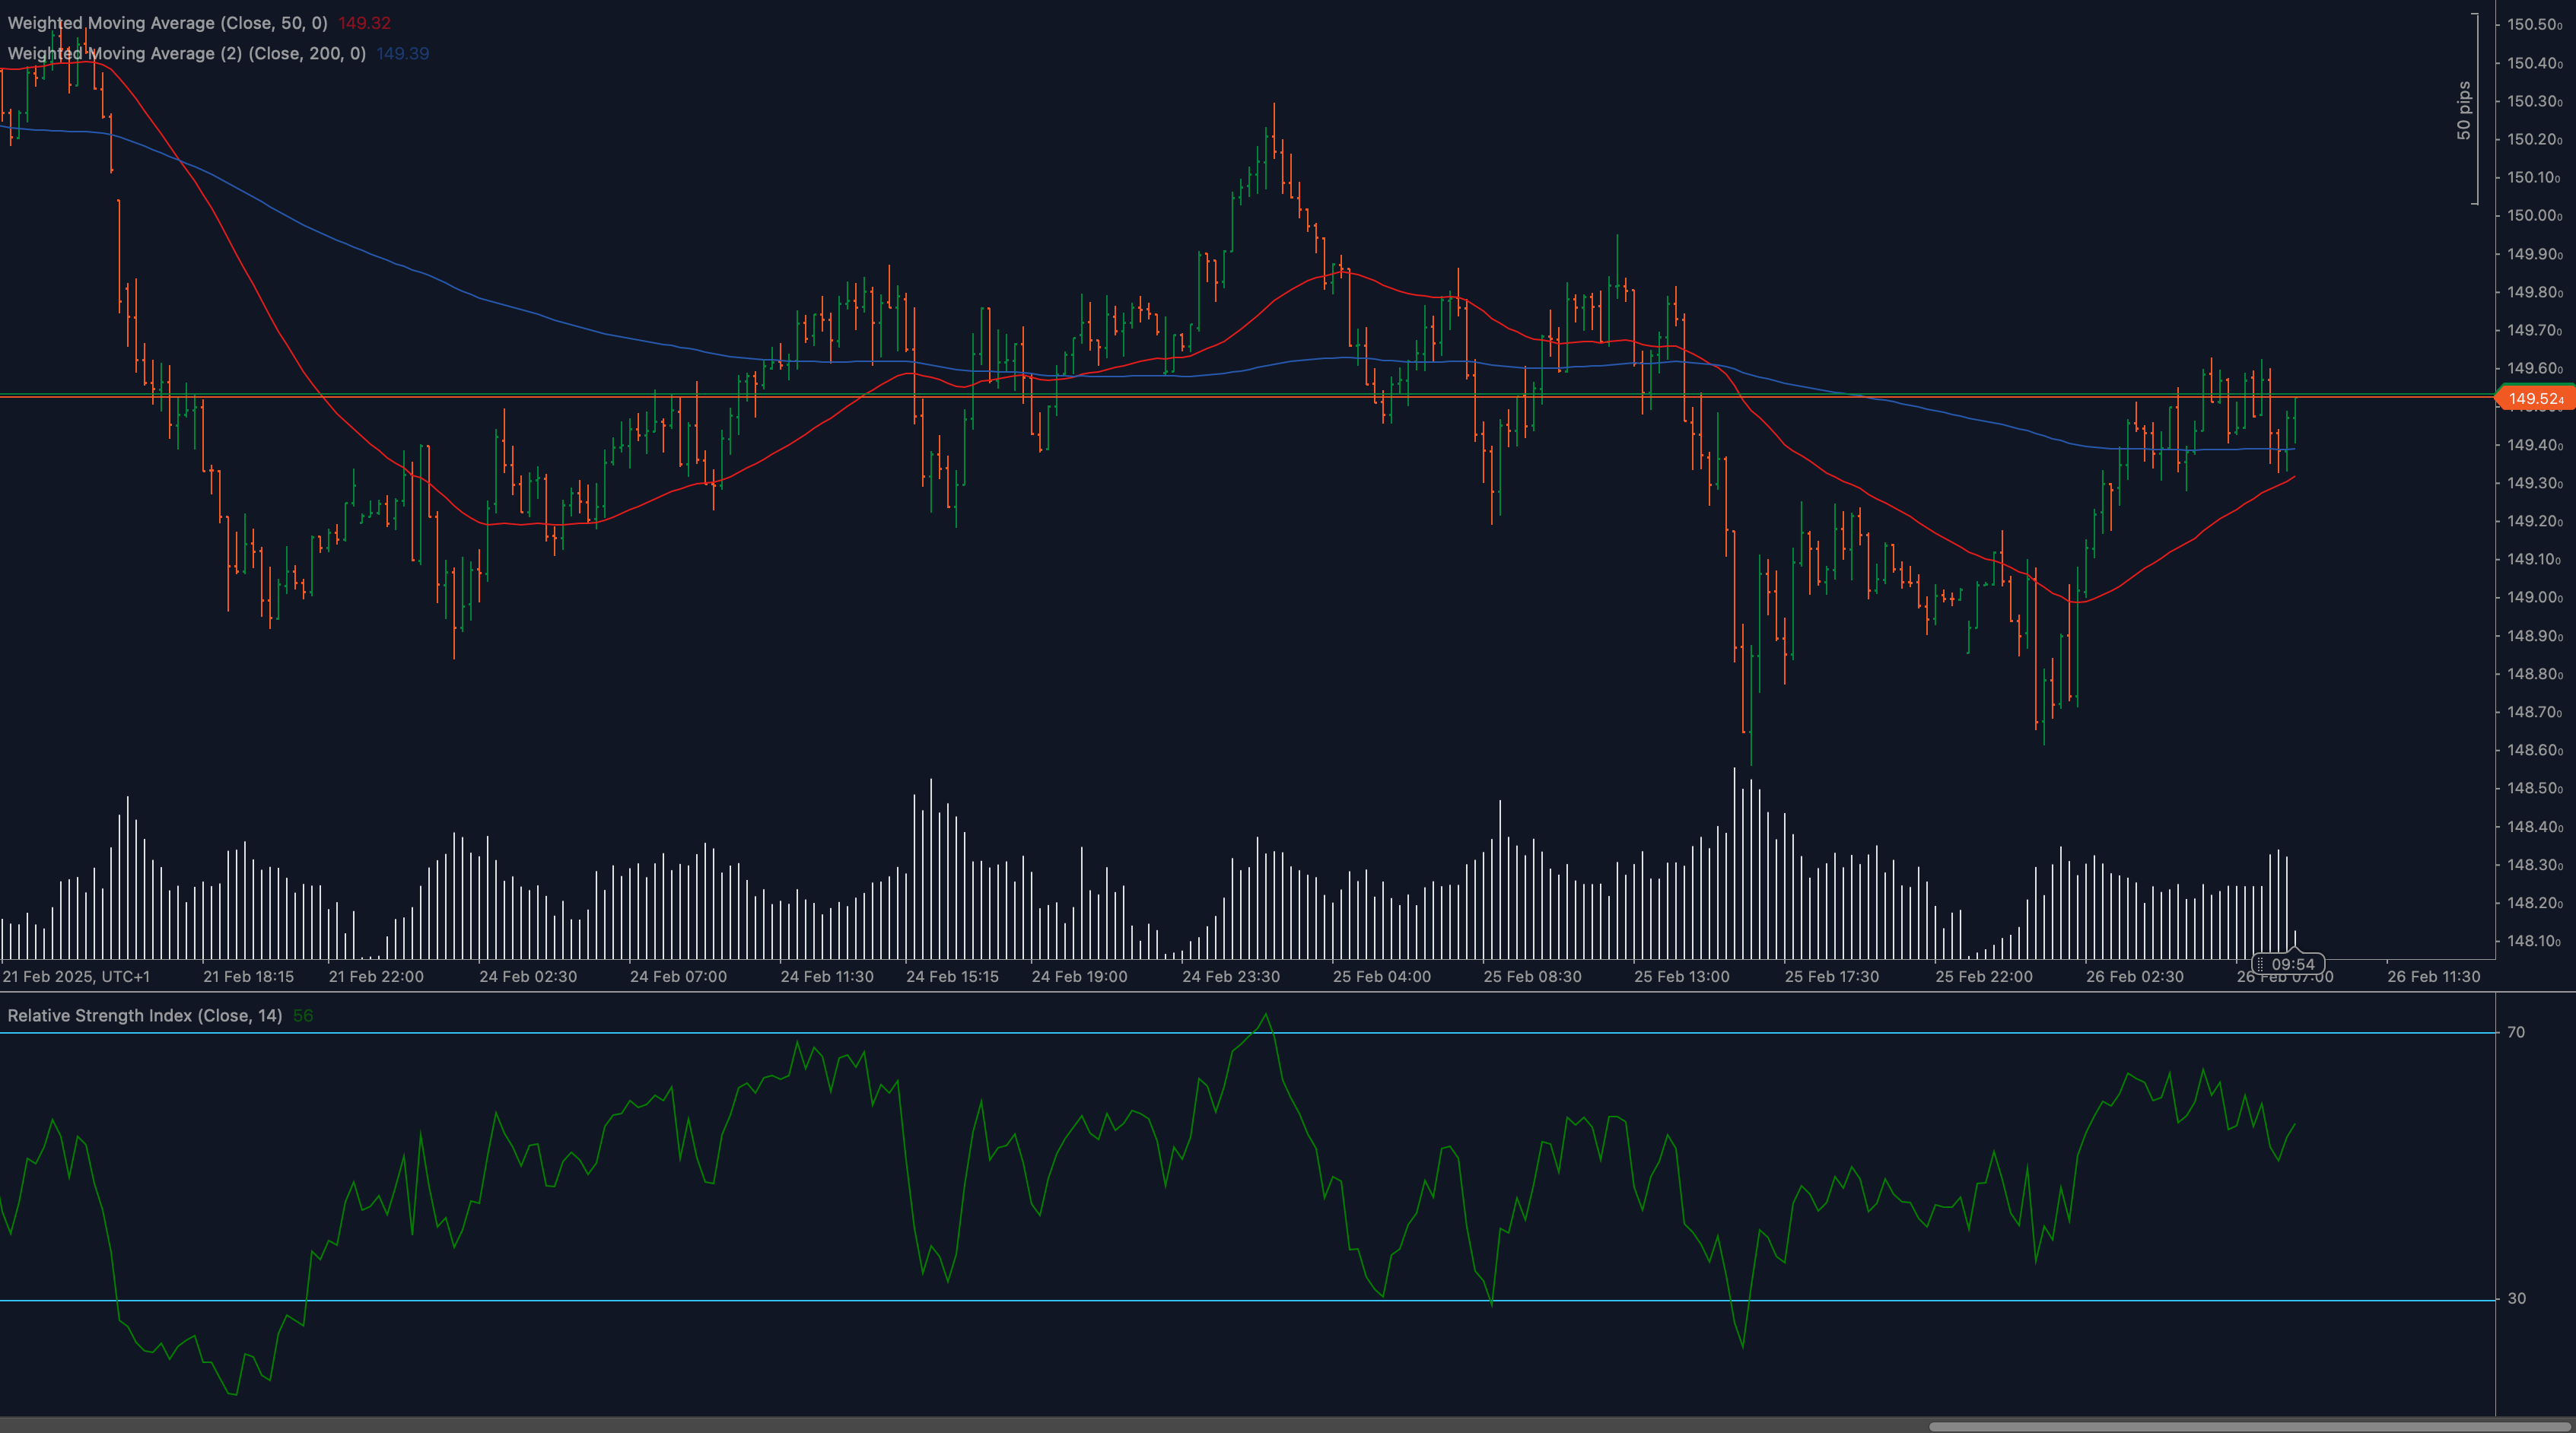
The USDJPY pair has demonstrated remarkable resilience, staging a significant recovery after dropping to lows near 148.60. The currency pair has now broken above the critical 50-day Weighted Moving Average (WMA) at 149.32 and is challenging the important horizontal resistance level at 149.50. This price action represents a potential trend shift after a period of downward pressure. Recent sessions have been characterized by increasing bullish momentum, with higher lows and higher highs forming on both price and momentum indicators. The recovery has occurred on healthy volume, suggesting genuine buying interest rather than a short-covering bounce. The technical picture has improved considerably as USDJPY has reclaimed key technical levels, potentially setting the stage for further upside if current resistance can be overcome decisively.
Technical Analysis
🔹 Support & Resistance Levels:
Resistance: 149.50 (current horizontal resistance), 149.80 (previous swing high), 150.00 (psychological level)
Support: 149.32 (50 WMA), 149.00 (round number), 148.60 (recent low)
Historical significance: The 149.50 zone has acted as a pivotal level throughout February, serving as both support and resistance on multiple occasions.
🔹 Moving Averages:
The 50 WMA currently sits at 149.32, recently broken to the upside, while the 200 WMA is located at 149.30, providing additional confluence support. The crossover of price above both key moving averages is a technically significant development. The moving averages are starting to flatten after a downward slope, potentially indicating shift in trend direction.
🔹 Relative Strength Index (RSI):
Currently reading around 60, the RSI shows improved momentum after bouncing from oversold territory. The formation of higher lows and higher highs in the RSI confirms building bullish momentum. The RSI has broken above its midpoint (50), typically a bullish signal, and no bearish divergence is present, suggesting momentum aligns with price action.
🔹 Price Action Analysis:
Recent candles show decisive bullish momentum with stronger closes and larger bodies. The latest bullish candles have closed above both the 50 WMA and horizontal resistance. Recent price action has formed higher lows and higher highs, a classic sign of trend reversal. Volume has increased during upward movements, confirming buying pressure. Multiple tests of support near 148.60-148.70 created a solid base for the recovery, and several recent sessions closed near their highs, demonstrating buying pressure into the close.
🔹 Chart Patterns:
A potential inverse head and shoulders pattern may be forming on the hourly timeframe. The recent consolidation and subsequent breakout resembles a cup and handle formation. The price structure shows a series of higher lows, creating an ascending trendline from the 148.60 bottom.
🔹 Fibonacci Analysis:
The recent advance from 148.60 to current levels has retraced approximately 61.8% of the prior decline. The 78.6% retracement level aligns with 149.80, potentially acting as the next resistance, while a full 100% retracement would target the 150.20 area, representing a complete reversal of the previous downtrend.
Market Outlook & Trading Scenarios
✅ Bullish Case:
Sustained trading above 149.50 could trigger a move toward 149.80 and eventually the psychological 150.00 barrier. A successful breakout above 150.00 would indicate a resumption of the larger uptrend, potentially targeting 150.80. Further upside movement supported by improving RSI readings and increasing volumes would validate bullish momentum. Key confirmation signals would include a daily close above 149.50 with above-average volume, RSI continuing to form higher highs above 60, and sustained trading above both the 50 and 200 WMAs.
✅ Neutral Case:
Continued consolidation between 149.00 and 149.50 as the market digests recent gains is possible. This scenario would involve range-bound trading while waiting for additional catalysts, moderate volume without significant directional bias, and RSI stabilizing in the 50-60 range without making new highs.
❌ Bearish Case:
Failure to hold above the 50 WMA (149.32) could lead to a retest of 149.00. Rejection at 149.50 with bearish candlestick formations would suggest potential reversal. Loss of 149.00 support could trigger a move back toward recent lows at 148.60. Volume expansion on downside movements would validate bearish momentum, while RSI turning down from current levels without breaking above 60 would signal weakening momentum.
Trading Considerations
📌 Breakout Strategy: Consider long positions on a decisive daily close above 149.50, targeting 149.80 initially and 150.00 as a secondary target. Use tight stops below the 50 WMA at 149.30 to limit downside risk and look for volume confirmation on the breakout for higher probability setups.
📌 Pullback Strategy: For those who missed the initial move, consider entries on pullbacks to the 149.30-149.40 zone, provided the 50 WMA holds as support. Keep stops below 149.00 to protect against false breakouts.
📌 Risk Management: Appropriate position sizing is crucial given USDJPY’s typically volatile nature and recent price action. Consider trailing stops as price advances to protect gains while allowing for potential upside continuation. A reasonable risk-to-reward ratio of at least 1:2 should be maintained for any new positions.
📌 Additional Considerations: Watch for potential volatility around upcoming economic data releases, particularly U.S. employment and inflation figures. Asian session behavior may provide clues for sustained direction, given the importance of Japanese market participants. Monitor U.S. Treasury yields, as USDJPY typically shows strong positive correlation with yield movements, and keep an eye on broader dollar strength/weakness as indicated by the Dollar Index (DXY).
Historical Context
USDJPY has demonstrated similar technical patterns throughout early 2025, with the 149.50 level repeatedly serving as a significant pivot point. Analysis of comparable setups over the past several months shows that breakouts above the 50 WMA that coincide with horizontal resistance have typically resulted in 70-100 pip advances. RSI readings above 60 after emerging from oversold territory have historically indicated sustainable momentum. The pair has shown sensitivity to the psychological 150.00 level, often requiring multiple attempts before decisive breaks, and volume patterns have been reliable predictors of sustained directional moves in USDJPY.
Conclusion
USDJPY is at a technically significant juncture after breaking above the 50 WMA at 149.32 and challenging the key horizontal resistance at 149.50. The price action shows improving bullish momentum after a period of downward pressure, with higher lows and higher highs forming on both price and momentum indicators. The bullish case is supported by the break above key moving averages, improved RSI readings, and healthy volume on advancing sessions. If the pair can maintain trading above 149.50, further upside toward 149.80 and potentially 150.00 appears likely. However, caution is warranted as the 149.50 level has proven to be stubborn resistance in the past. Rejection at current levels could lead to renewed consolidation or even a move back toward support. Traders should watch for convincing closes above resistance and monitor volume patterns for confirmation of the breakout’s validity. Risk management remains paramount, with appropriate stop placement and position sizing essential given the pair’s historical volatility. The coming sessions will be crucial in determining whether the current recovery develops into a sustained uptrend or faces rejection at resistance.
⚠️ Disclaimer: This analysis is for informational purposes only and should not be considered financial advice. Trading carries risk, and past performance does not guarantee future results. Conduct independent research before making investment decisions.