📊 MARKET OVERVIEW
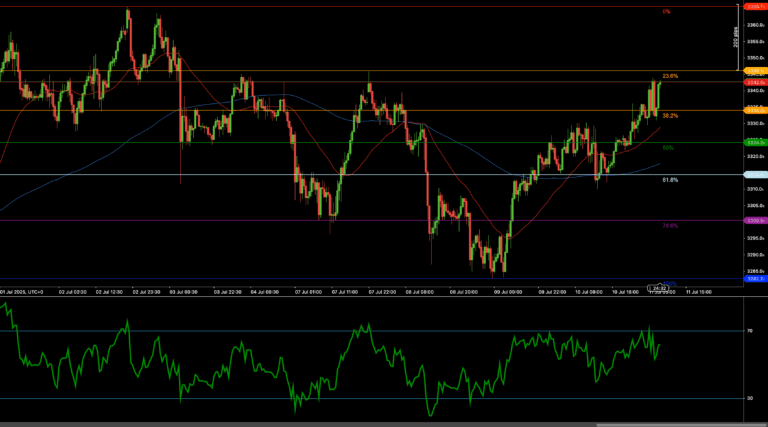
Silver (XAGUSD) has demonstrated remarkable bullish momentum in recent trading sessions, breaking above the significant $32.00 psychological resistance level. The precious metal has established a clear uptrend since late February 2025, when it found strong support near the $30.80 level. This technical analysis examines the current state of silver trading, highlighting critical support and resistance zones, momentum indicators, and potential trading scenarios for silver traders and investors.
The broader context for silver’s performance includes its traditional role as both an industrial metal and safe-haven asset, with recent price action suggesting increasing investor confidence in its upside potential. Silver’s technical posture has strengthened considerably over the past week, with price action establishing firmly above both the 50 and 200-period moving averages, signaling robust bullish sentiment in the market.
📈 TECHNICAL ANALYSIS
What Are the Key Support and Resistance Levels for XAGUSD?
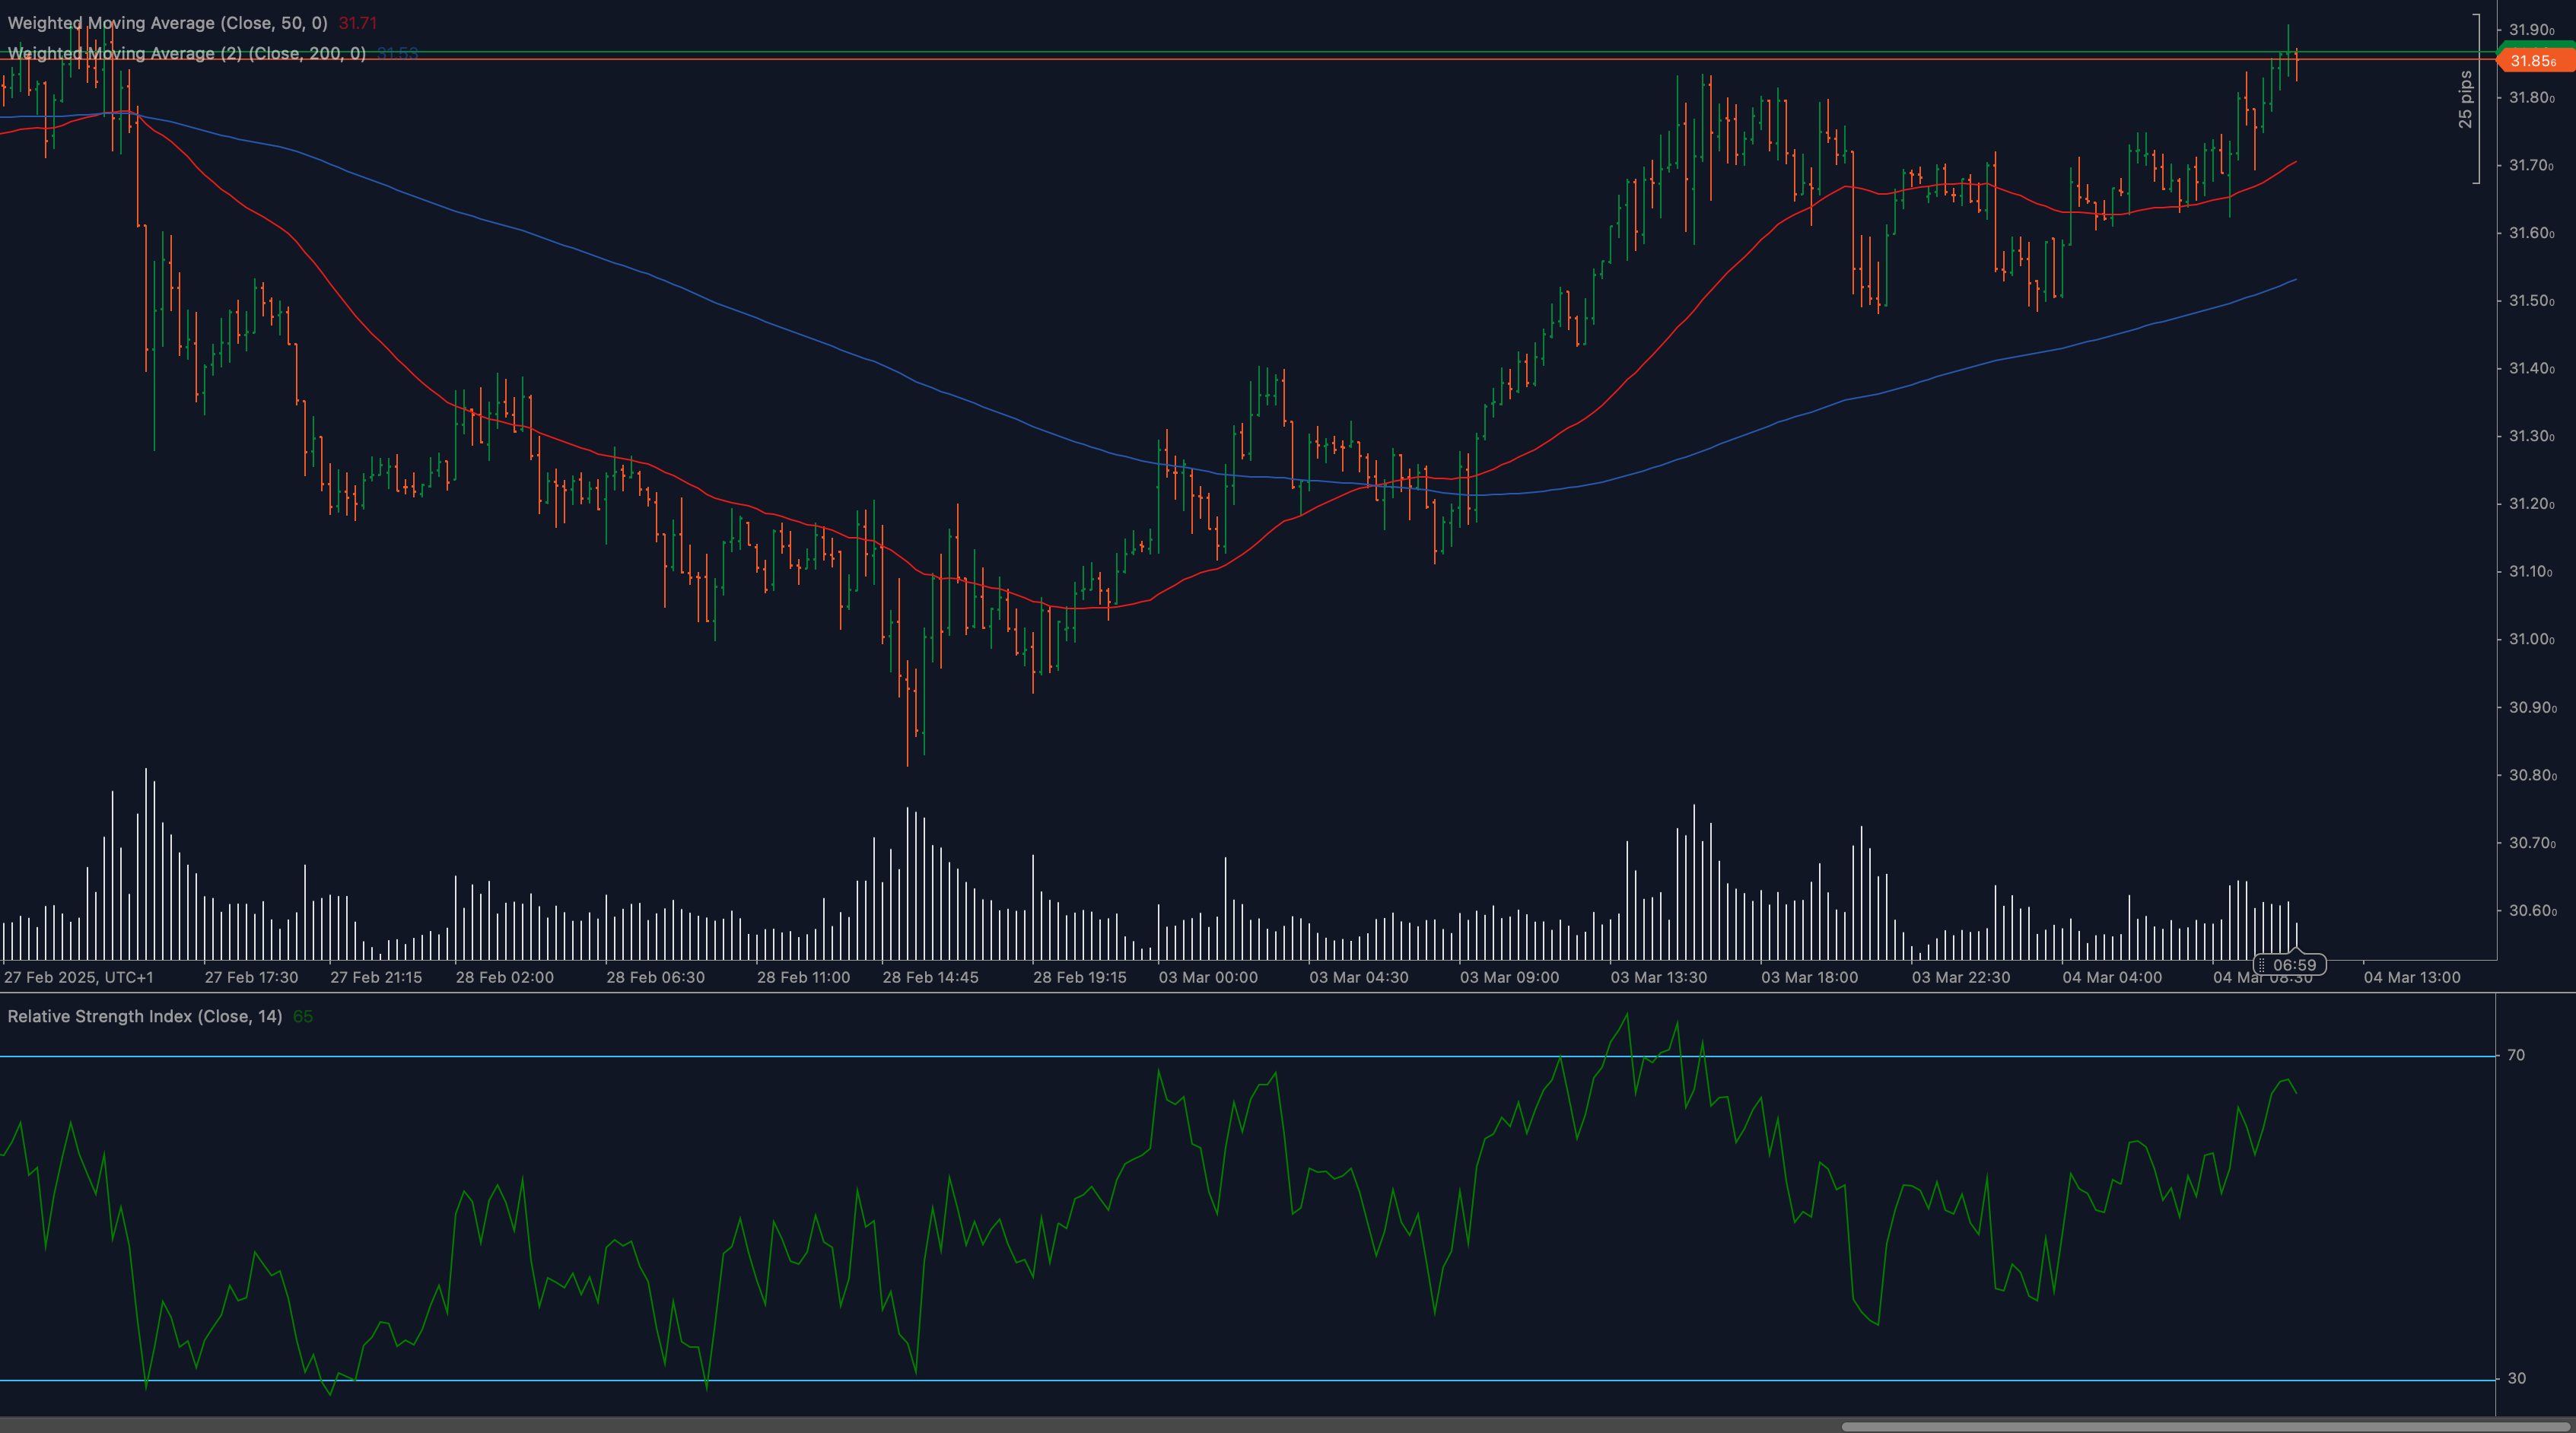
The current price structure for XAGUSD reveals several critical technical levels that traders should monitor closely. The most significant support zone lies at $31.50, which previously acted as resistance before being breached. This level coincides closely with the 50-period moving average (red line), enhancing its importance as a technical reference point. Secondary support can be found at $31.20, aligning with the 200-period moving average (blue line), forming a strong foundation for the current uptrend.
On the resistance side, the immediate level to watch is $32.00, which has been tested and recently broken. This psychological round number has historical significance in silver trading and often attracts substantial market attention. Beyond this, potential resistance might emerge at $32.50 and $33.00, levels not visible on the current chart but important historical zones for silver prices.
Moving Averages Analysis
The relationship between price and key moving averages provides valuable insights into XAGUSD’s technical condition. The 50-period moving average (red line) has transitioned from resistance to support, now trending upward after a period of decline. The 200-period moving average (blue line) has also begun curving upward, confirming the bullish momentum. Most importantly, price action is trading confidently above both these indicators, with the 50-period MA having crossed above the 200-period MA in early March – a classic golden cross formation signaling potential for continued upside momentum.
The separation between price and these moving averages has widened, suggesting strong bullish momentum but also indicating the possibility of a short-term overbought condition that might lead to temporary consolidation.
RSI Analysis and Momentum
The 14-period Relative Strength Index (RSI) shown at the bottom of the chart provides critical insights into silver’s momentum characteristics. The RSI has maintained readings consistently above the 50 mid-line since early March, confirming the strength of the prevailing uptrend. Currently registering readings around 65-70, the indicator suggests robust bullish momentum without yet reaching extreme overbought conditions (typically considered above 70).
Notably, the RSI has formed a series of higher lows and higher highs, mirroring the pattern in price action and confirming the strength of the bullish trend. No significant bearish divergence is present, suggesting the uptrend remains technically healthy despite the rapid appreciation in recent sessions.
Price Action and Chart Patterns
XAGUSD’s price action reveals several noteworthy patterns that support the bullish case. Since the late February low near $30.80, silver has established a clear series of higher lows and higher highs – the definitive characteristic of an uptrend. The candle formations show strong buying pressure, with several bullish engulfing patterns visible during the advance, particularly in early March when price overcame the 50-period moving average.
The current breakout above $32.00 shows strong conviction, with a bullish candle closing near its high and followed by continuation. Volume patterns (visible in the histogram below the price chart) show increased participation during upward movements, confirming genuine buying interest rather than merely technical reactions.
Fibonacci Retracement Levels
While specific Fibonacci retracement levels aren’t drawn on the chart, applying the tool to the move from the February low ($30.80) to the current high would identify key retracement levels that often serve as support in pullbacks. The 38.2% retracement would likely align near the $31.50 support, reinforcing its significance as a potential buying opportunity during corrective phases.
🔍 MARKET OUTLOOK & TRADING SCENARIOS
Bullish Scenario
The primary bullish scenario for XAGUSD envisions continued momentum above the recently breached $32.00 level, potentially targeting the $32.50 and $33.00 resistance zones in coming sessions. Supporting this outlook is the strong positioning above both key moving averages, healthy RSI readings that aren’t yet extremely overbought, and the series of higher lows and highs confirming trend strength. For this scenario to unfold, silver would need to maintain support above $31.80-$32.00 on any intraday pullbacks, with increased volume confirming genuine buying interest.
Under this scenario, traders might consider bullish positions with defined risk parameters, potentially using the 50-period moving average as a trailing stop reference point. Price targets could include the psychological $33.00 level and beyond, with trailing stops to protect profits as the move develops.
Neutral Scenario
A neutral scenario would involve consolidation near current levels, with price action establishing a range between approximately $31.50 support and $32.20 resistance. This would represent healthy digestion of recent gains before a potential continuation. During such consolidation, traders might observe the 50-period moving average continuing to rise and provide dynamic support, maintaining the overall bullish structure while allowing momentum indicators to reset from potentially overbought conditions.
Trading strategies in this scenario might focus on range-bound approaches, potentially buying near support and selling near resistance, with smaller position sizes reflecting the transitional market phase.
Bearish Scenario
The bearish case, while less supported by current technicals, would involve failure to maintain the breakout above $32.00, followed by a decisive move below the 50-period moving average near $31.50. Such a development could trigger stops placed by recent buyers and potentially lead to a deeper correction toward the 200-period moving average around $31.20 or even the $30.80 prior low.
This scenario would likely require a fundamental catalyst or broader market risk-off event, as the technical structure currently remains definitively bullish. Traders considering this scenario should watch for warning signs such as increasing volume on downward movements or bearish divergence forming on momentum indicators.
💼 TRADING CONSIDERATIONS
Implementing effective trading strategies for XAGUSD requires consideration of several key factors beyond pure technical analysis. Position sizing should reflect both market volatility and individual risk tolerance, with silver’s historical tendency for sharp moves suggesting conservative initial position sizes with potential scaling in as trades develop favorably.
Stop placement represents a critical consideration, with logical positioning below key support levels such as $31.50 or the 50-period moving average. However, silver’s volatility characteristics mean that excessively tight stops might be triggered by normal market noise; therefore, allowing appropriate breathing room while maintaining defined risk parameters is essential.
For traders considering long positions following the recent breakout, several approaches merit consideration:
- Breakout continuation strategy: Entering on pullbacks to the $31.80-$32.00, using the former resistance as new support, with stops below $31.50 and targets at $32.50 and $33.00.
- Moving average strategy: Using the 50-period moving average as a dynamic reference point, entering long positions on touches of this technical indicator with stops below, targeting new highs above $32.00.
- Momentum-based approach: Using RSI pullbacks to the 50-60 zone as entry opportunities, provided price maintains above key moving averages, with trailing stops adjusted as the trend develops.
Risk-reward considerations suggest targeting minimum 2:1 ratios for directional trades in the current environment. Silver traders should also remain mindful of broader market correlations, particularly with gold prices, the US dollar index, and real interest rates, as these relationships often provide confirming or contradicting signals to pure XAGUSD technical analysis.
🏁 CONCLUSION
The technical analysis of XAGUSD reveals a predominantly bullish picture, with price action establishing above key moving averages and significant resistance levels. The recent breakout above $32.00 represents an important technical development that could pave the way for further gains toward $32.50 and potentially $33.00 in the coming sessions.
Support has been established at $31.50 (coinciding with the 50-period moving average) and $31.20 (200-period moving average), providing reference points for potential buying opportunities on pullbacks. Momentum remains healthy as evidenced by RSI readings and the absence of significant bearish divergence, though traders should remain alert to signs of exhaustion given the rapid recent appreciation.
For silver traders and investors, the current technical structure offers various strategic opportunities, from breakout continuation approaches to moving average-based strategies, with clear levels for risk management. As always in precious metals trading, maintaining discipline with position sizing and stop placement remains paramount given silver’s historical volatility characteristics.
⚠️ DISCLAIMER:
This analysis is for informational purposes only and should not be considered financial advice. Trading carries risk, and past performance does not guarantee future results. Conduct independent research before making investment decisions. The XAGUSD market can be particularly volatile, and technical levels may change rapidly with market conditions. Always use proper risk management techniques and consider your personal financial situation before trading silver or any financial instrument.