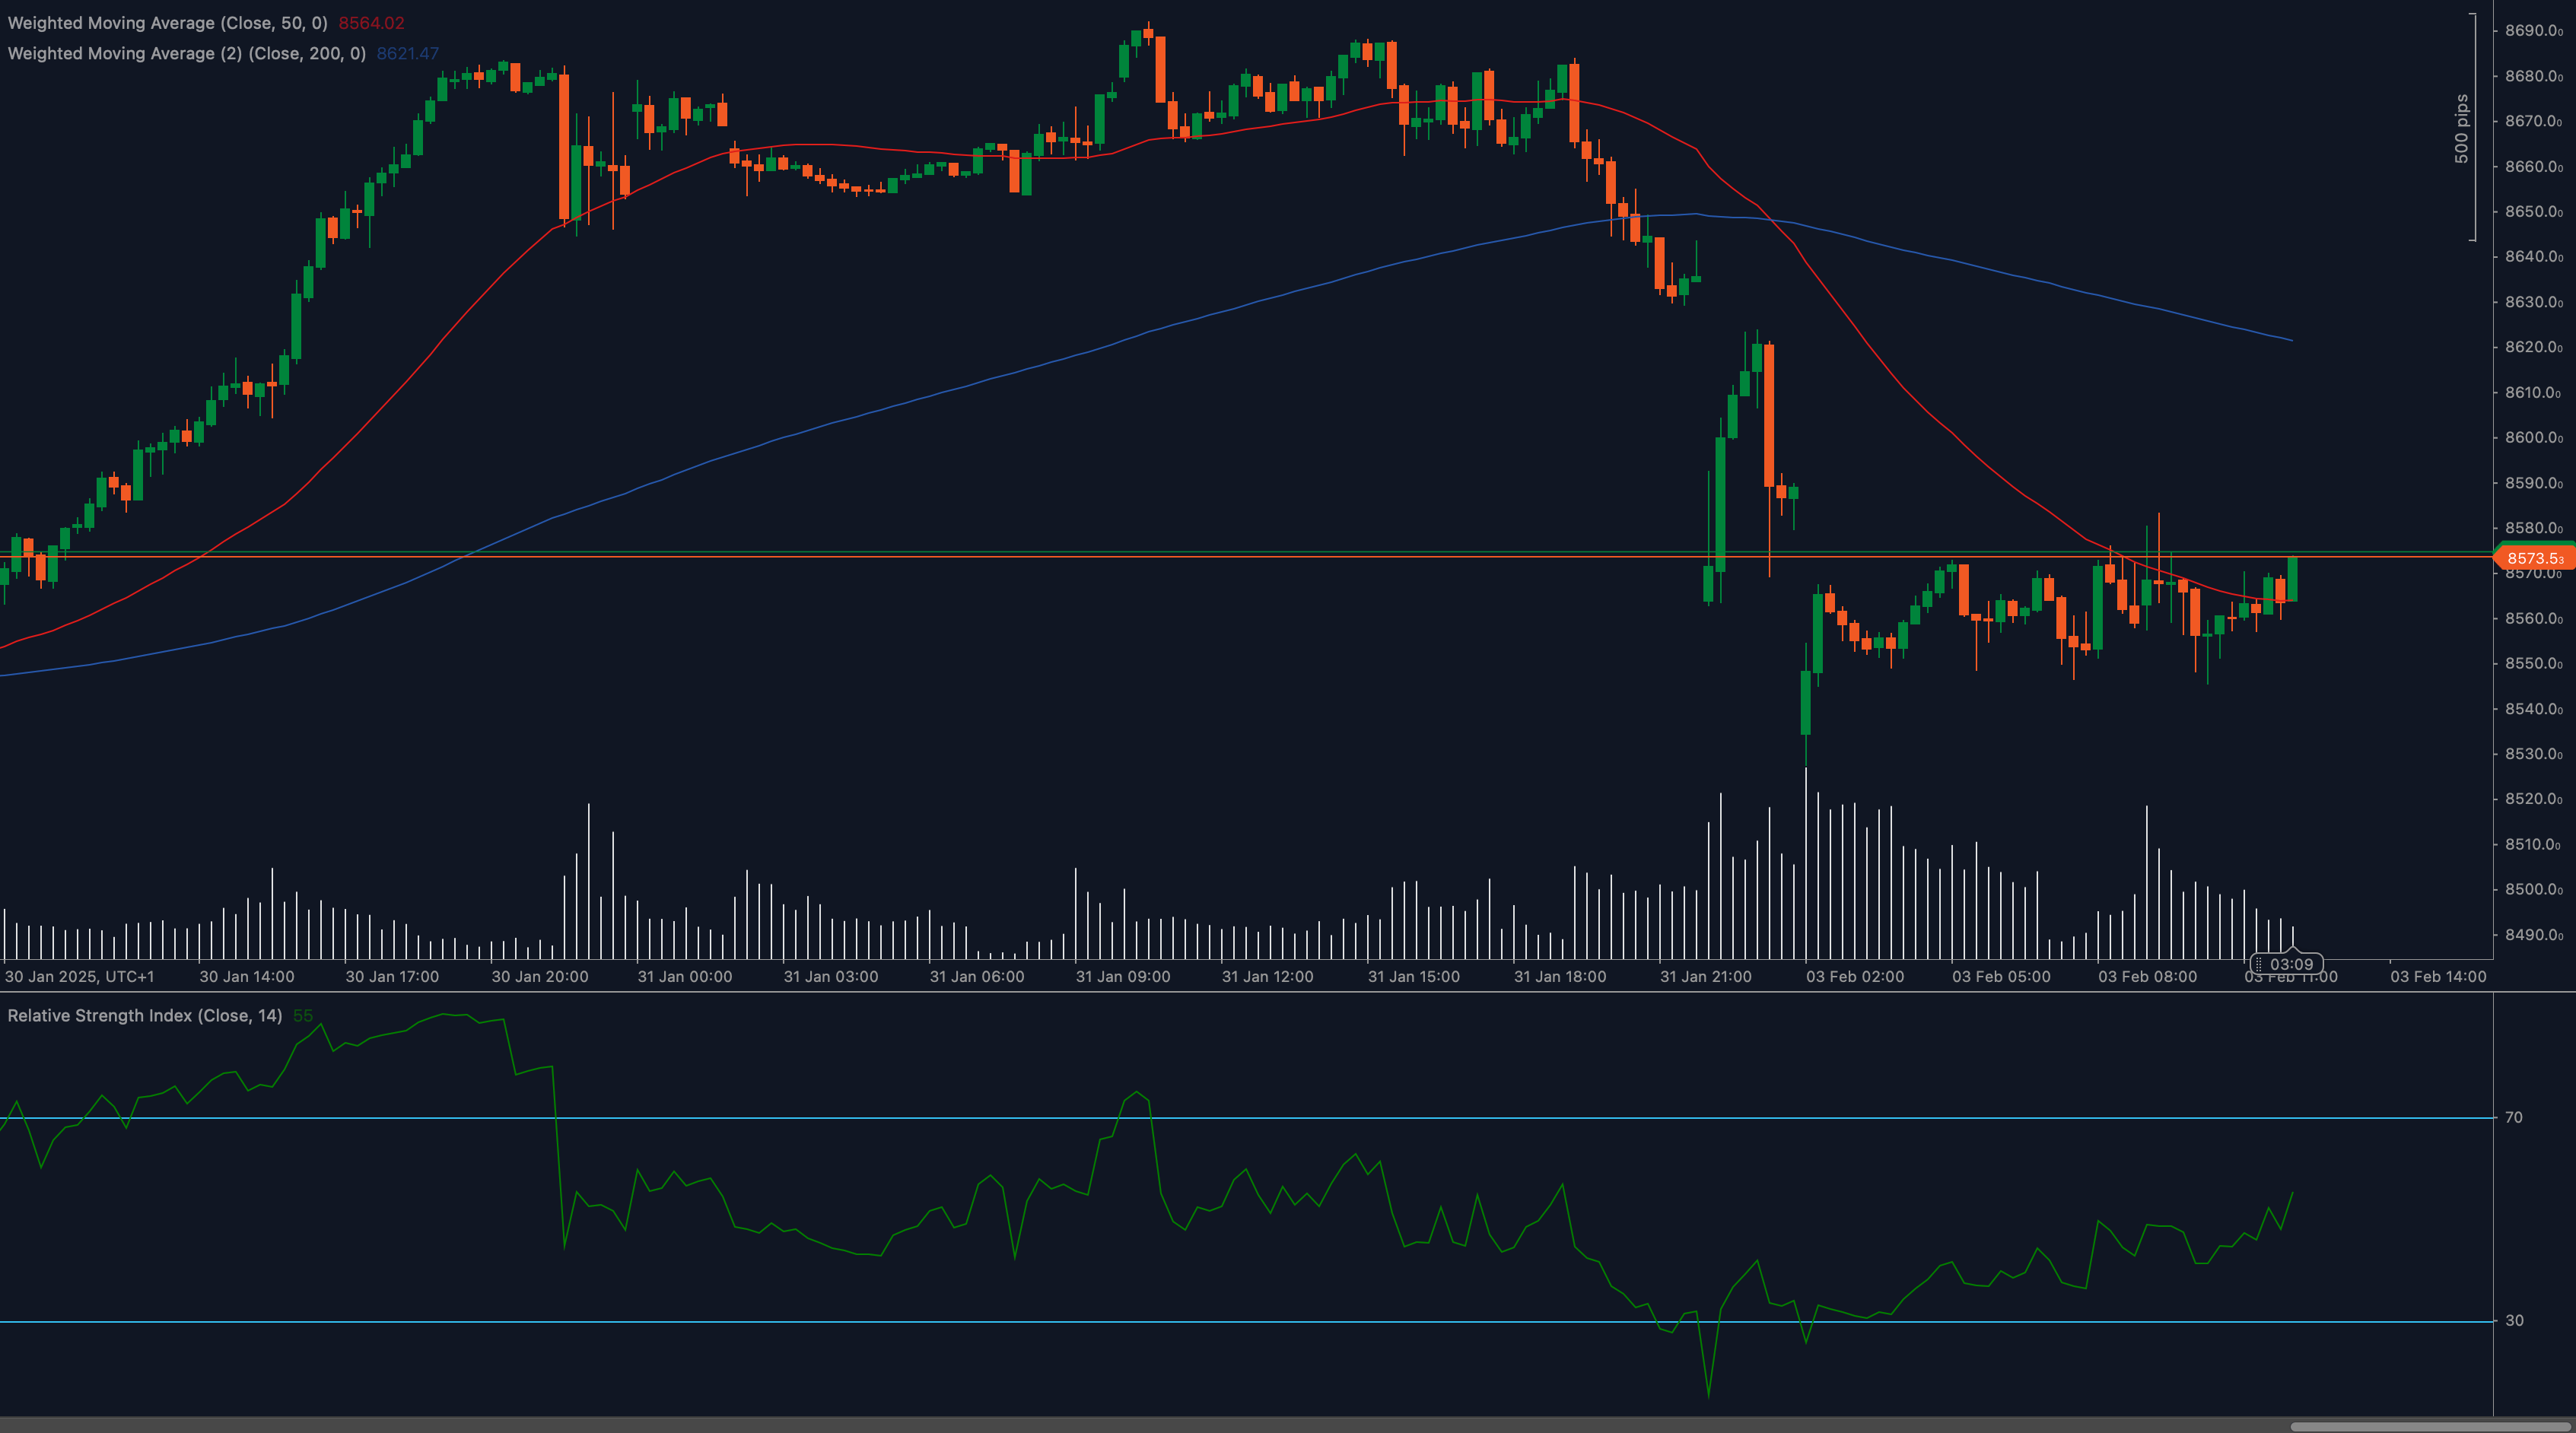
The FTSE 100 (UK100) has rebounded after a sharp drop but now faces resistance at 8,575. Bulls are attempting to sustain the recovery, but momentum remains uncertain as price action consolidates.
Technical Analysis
📉 Weighted Moving Averages Suggest Bearish Pressure
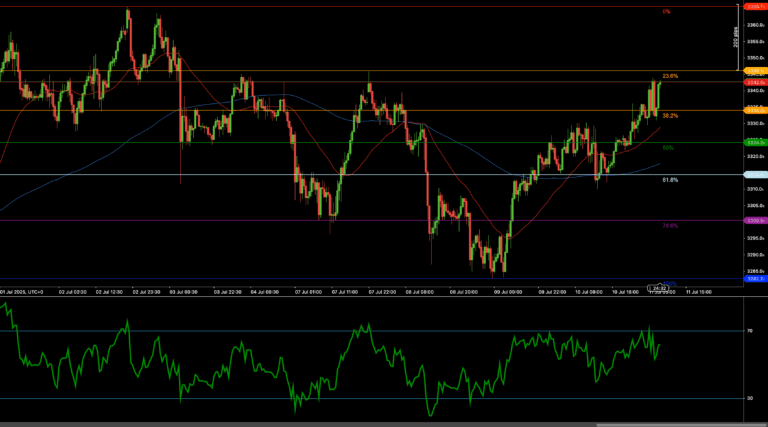
The 50 Weighted Moving Average (WMA) at 8,564 is below the 200 WMA at 8,621, reinforcing a bearish bias despite the recovery. A break above the 50 WMA could indicate renewed bullish momentum.
📊 RSI Shows Improving Sentiment
The Relative Strength Index (RSI) is at 55, suggesting recovering momentum. A push above 60 RSI could further support the bullish case, while a drop below 50 RSI may invite more selling.
🔎 Resistance and Support Levels to Watch
FTSE 100 is at a critical resistance level, and traders are closely watching for a breakout or rejection.
Key Levels to Watch
Support Levels:
- 8,540: Immediate support level in case of rejection.
- 8,500: Stronger support where buyers may step in.
Resistance Levels:
- 8,575: Immediate resistance currently limiting further upside.
- 8,600: Key level to clear for extended gains.
Fundamental Drivers
The FTSE 100 remains influenced by global equity sentiment, interest rate expectations, and earnings reports. Investors are weighing the impact of UK economic data and broader risk trends as the market navigates key resistance.
Outlook
FTSE 100’s ability to break above 8,575 will determine its next move. A successful breakout could push the index toward 8,600, while failure to hold gains may lead to a retest of 8,540 or lower.
Traders should monitor price action and upcoming economic data for further directional cues.