📊 MARKET OVERVIEW
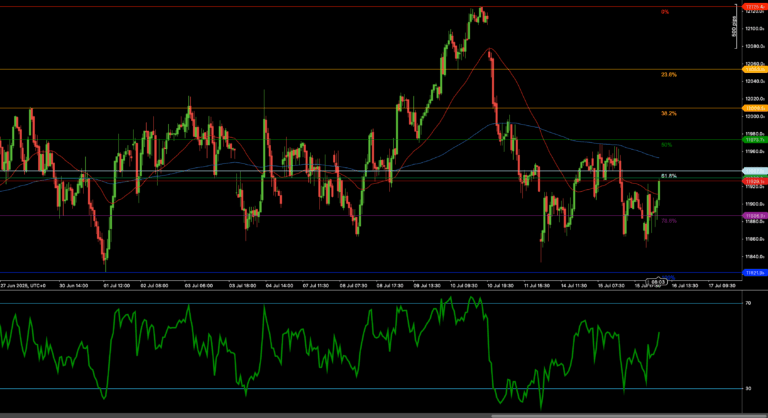
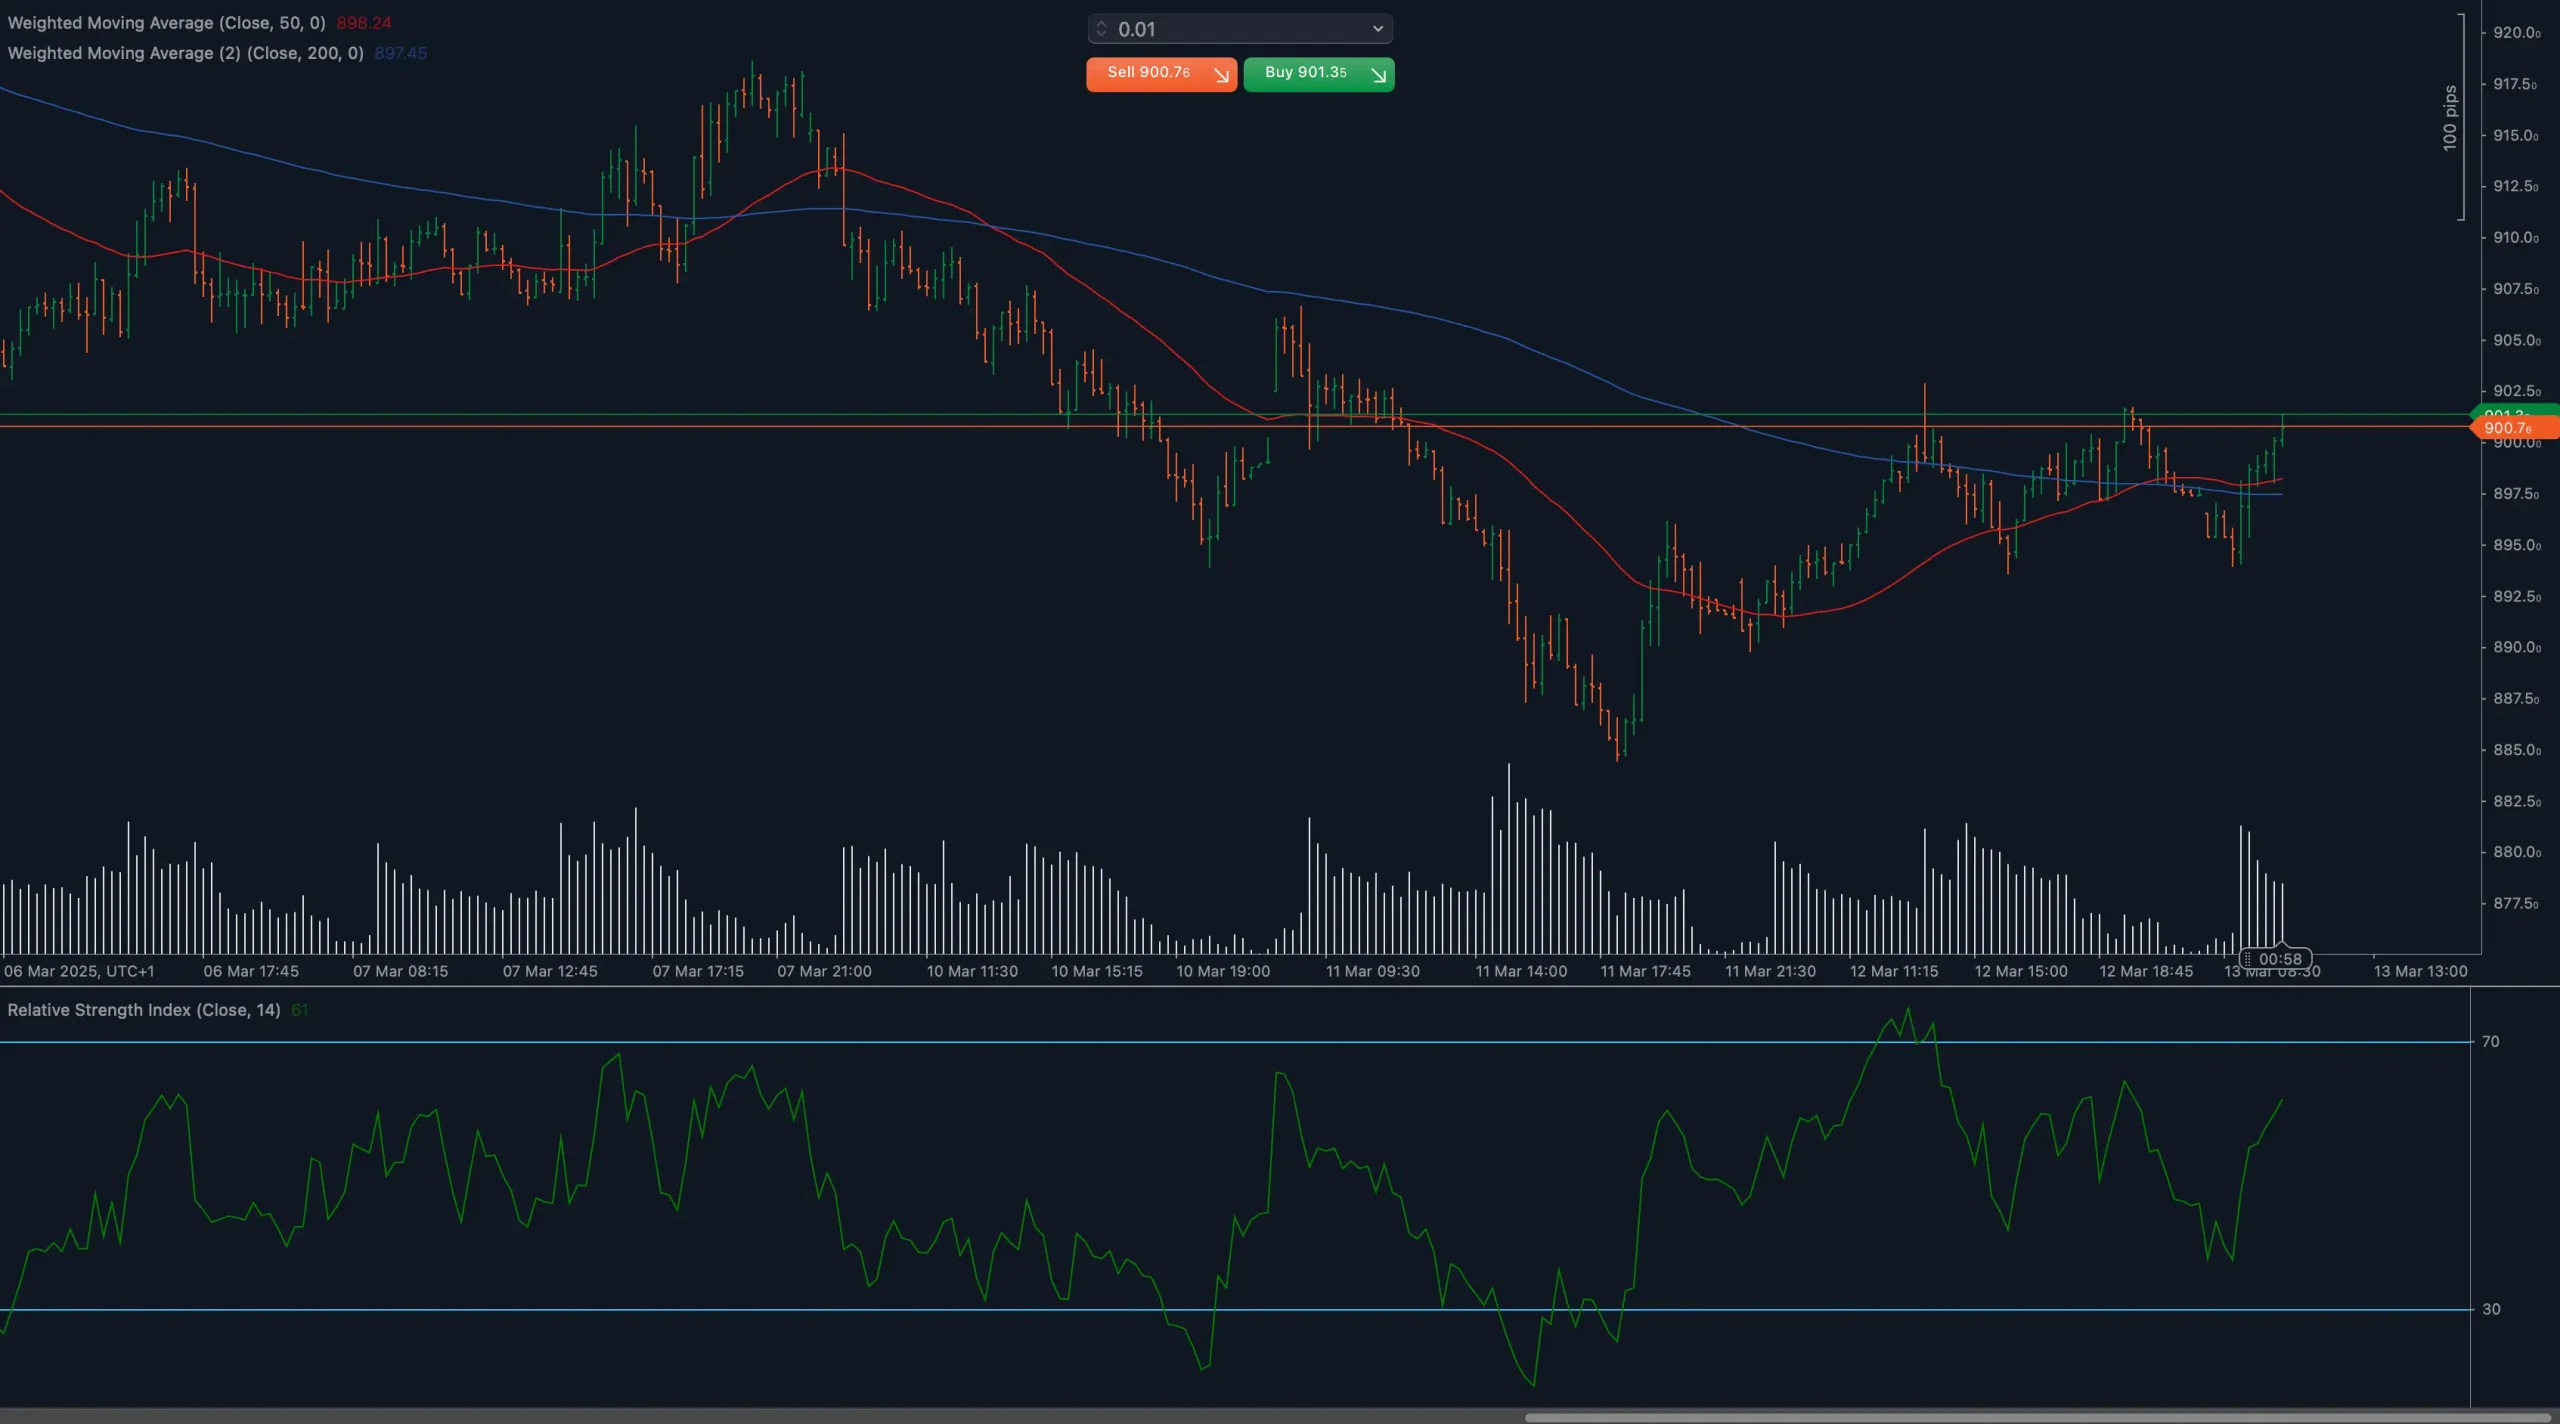
The AEX25 index is navigating a crucial technical juncture as it attempts to establish recovery momentum above the 50-day moving average (currently at 897.45). After finding solid support near the 886.00 level during the mid-March pullback, the Dutch benchmark has been steadily climbing, with current price action around 900.79 signaling potential for an upside continuation. However, the 200-day moving average at 908.24 looms as significant overhead resistance, creating a decisive battleground for near-term market direction.
📈 TECHNICAL ANALYSIS
What Are the Key Support and Resistance Levels for AEX25?
Looking at the AEX25 chart, several critical price levels stand out. Immediate support has formed at 895.00, reinforced by recent price action and the rising 50-day MA. Below this, secondary support exists at 890.00, while the more substantial support zone at 886.00 has already proven its strength during the recent pullback. For resistance, the immediate barrier appears at 901.35 (visible from the buy level indicator), with the 200-day MA at 908.24 representing the more significant overhead resistance. Breaking above this level would significantly strengthen the bullish case for AEX25.
Moving Average Analysis and Dynamic Price Levels
The relationship between the 50-day and 200-day moving averages provides crucial context for AEX25’s current position. The 50-day MA (897.45) is trending below the 200-day MA (908.24), confirming the medium-term bearish bias still in effect. However, price action has recently broken above the 50-day MA, suggesting growing bullish momentum. This moving average crossover situation creates a dynamic tension zone between 897.45 and 908.24 where price will likely experience heightened volatility as traders position for the next directional move.
RSI Momentum Analysis and Divergence Patterns
The Relative Strength Index (14) shows increasing bullish momentum, with the indicator pushing above the midpoint level (50) and approaching the 70 level. This momentum shift aligns with the price’s movement above the 50-day MA. No significant divergence patterns are currently visible, suggesting the price and momentum are moving in tandem. The RSI’s trajectory indicates building buying pressure, particularly as it maintained higher lows during recent price consolidation phases.
Price Action and Candlestick Analysis
Recent candlestick patterns reveal important insights about AEX25’s momentum. After forming a solid bottoming pattern near 886.00, the index has established a series of higher lows and higher highs – a classic sign of strengthening bullish sentiment. The most recent trading sessions show strong green candles with solid bodies, indicating decisive buying pressure. Volume patterns generally support this upturn, with above-average volume accompanying bullish moves, suggesting institutional participation in the rally.
Chart Patterns and Formation Analysis
The AEX25 appears to be forming an inverse head and shoulders pattern on the hourly timeframe visible in the chart, with the neckline approximately at the 901.35 level. This bullish reversal pattern, if confirmed with a decisive break above the neckline, would target movement toward the 915-920 zone. Additionally, the price action is shaping a potential ascending triangle formation between the horizontal resistance at 901.35 and the rising trendline connecting recent lows, further supporting the bullish case.
Fibonacci Retracement Levels and Extension Targets
While not explicitly drawn on the chart, Fibonacci retracement levels from the recent swing high to low suggest the AEX25 has already reclaimed the 50% retracement level and is approaching the 61.8% retracement around 902.50. Breaking above this level would strengthen the recovery case. Potential Fibonacci extension targets on a confirmed breakout would project toward 915.00 (1.0 extension) and 925.00 (1.618 extension), aligning with previous resistance zones from earlier price action.
🔍 MARKET OUTLOOK & TRADING SCENARIOS
Bullish Scenario for AEX25
If the AEX25 maintains momentum above the 50-day MA (897.45) and successfully breaks through the immediate resistance at 901.35, we could see an acceleration toward the critical 200-day MA at 908.24. A daily close above this level would significantly strengthen the bullish case, potentially triggering a move toward the 915.00 level, followed by the more significant 920.00 psychological resistance. Supporting indicators for this scenario would include RSI sustaining above 60 and increasing trading volumes on upward moves.
Neutral Scenario for AEX25
The AEX25 might establish a consolidation phase between the 50-day MA (897.45) and resistance at 901.35, reflecting market indecision at this crucial juncture. In this scenario, price would likely oscillate within this range as bulls and bears battle for control. Traders should watch for decreasing volume during this consolidation, which would suggest a building pressure that could eventually lead to a more decisive directional move. The direction of the eventual breakout would determine the next significant price swing.
Bearish Scenario for AEX25
Should the AEX25 fail to maintain levels above the 50-day MA and break below support at 895.00, this would signal weakening momentum and potential for a deeper correction. A decisive drop below 890.00 would invalidate the recent recovery attempt and potentially target a retest of the 886.00 support zone. If this level fails to hold, we could see an acceleration toward the 880.00 psychological support level. Warning signs for this scenario would include RSI turning down from the 50 level and increasing volume on downward moves.
💼 TRADING CONSIDERATIONS
When approaching the AEX25 index in the current technical environment, risk management becomes particularly critical given the conflicting signals between short-term bullishness and medium-term bearish trend structure. Traders should consider utilizing the clearly defined support and resistance levels for precise entry and exit points. Long positions might be considered on successful retests of the 50-day MA with appropriate stop-losses below 895.00, while more conservative traders might wait for confirmation of a break above the 200-day MA before entering.
For those already in positions, trailing stops based on the 50-day MA could provide a technical-based method for protecting profits while allowing upside potential. Given the current volatility profile of AEX25, position sizing should be calculated to account for approximately 15-20 points of adverse movement, particularly for positions held overnight. The optimal reward-to-risk ratio would target at least 2:1, aiming for the resistance levels identified in the bullish scenario while maintaining disciplined stop-loss placement.
🏁 CONCLUSION
The AEX25 index is at a pivotal technical juncture, showing promising signs of recovery above the 50-day moving average while approaching significant resistance zones. The bullish case is supported by strengthening momentum indicators and positive price action patterns, but remains contingent on breaking above the 200-day MA resistance. Traders should remain vigilant for confirmation or invalidation signals in the coming sessions, as the resolution of this technical standoff will likely determine the index’s direction in the near term. With clearly defined support and resistance levels, the current setup offers favorable risk-reward opportunities for disciplined traders.
⚠️ DISCLAIMER
This technical analysis of the AEX25 index is provided for informational purposes only and does not constitute investment advice. Trading and investing in financial markets involves substantial risk of loss and is not suitable for all investors. Past performance is not indicative of future results. Before making any investment decisions, you should conduct your own research and consult with a qualified financial advisor. The author and publisher assume no responsibility for any trading results that may occur from following the information presented in this analysis.