📊 MARKET OVERVIEW
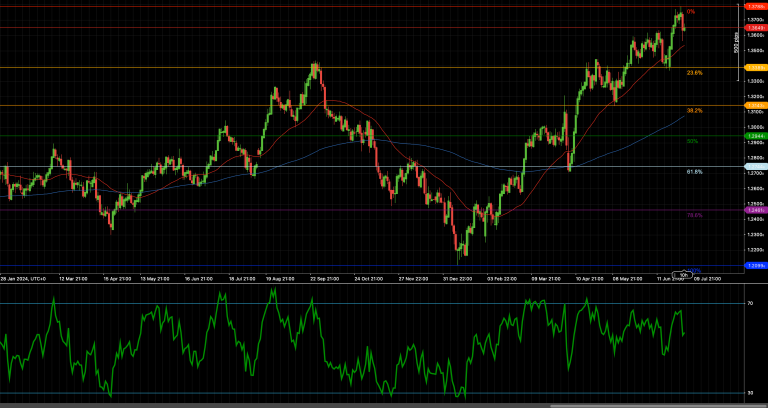
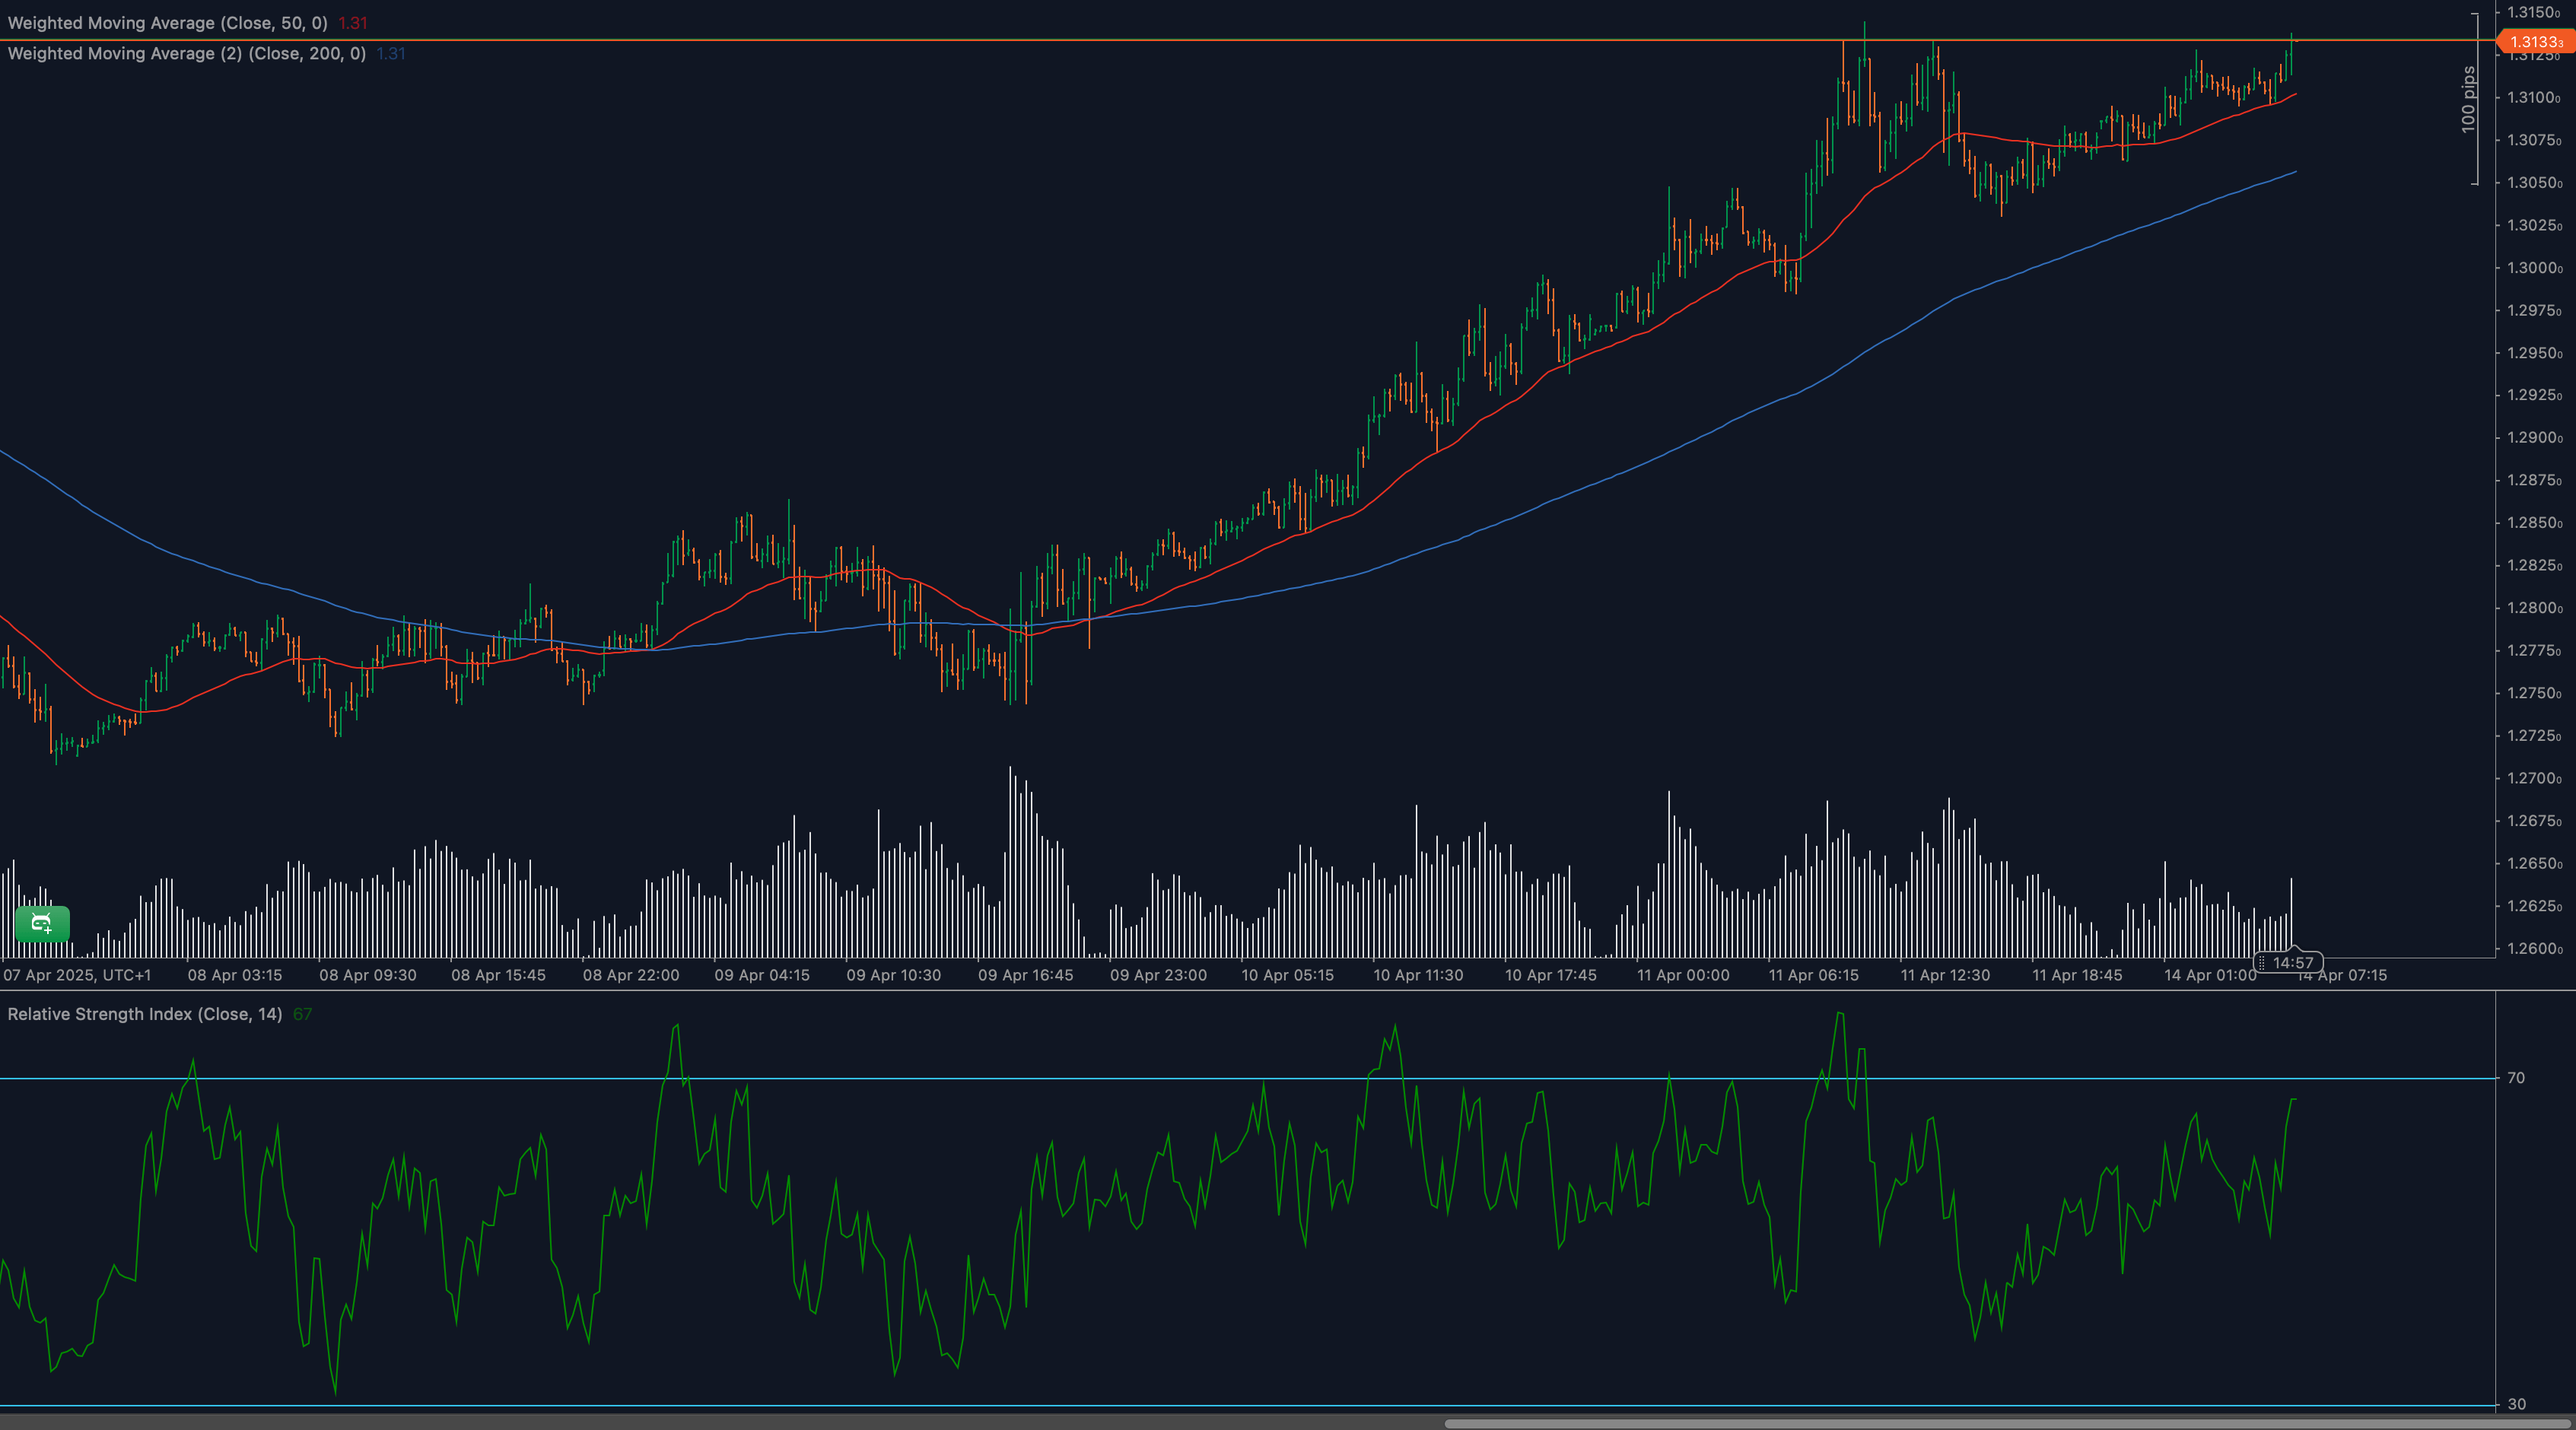
The GBP/USD pair is currently testing a crucial resistance zone at 1.3150 after a steady and robust bullish advance. Market sentiment remains broadly supportive for the British Pound, aided by weakening US dollar pressures, technical momentum, and favorable economic indicators from the UK. Traders are closely monitoring the reaction around this pivotal resistance level, which may define the next medium-term directional bias for the pair.
With key moving averages and momentum indicators like RSI showing clear bullish sentiment, a comprehensive technical examination will provide essential insights into possible breakout scenarios or corrective actions from current levels. Let’s delve deeply into the relevant technical factors shaping GBP/USD.
📈 TECHNICAL ANALYSIS
What Are the Key Support and Resistance Levels for GBP/USD?
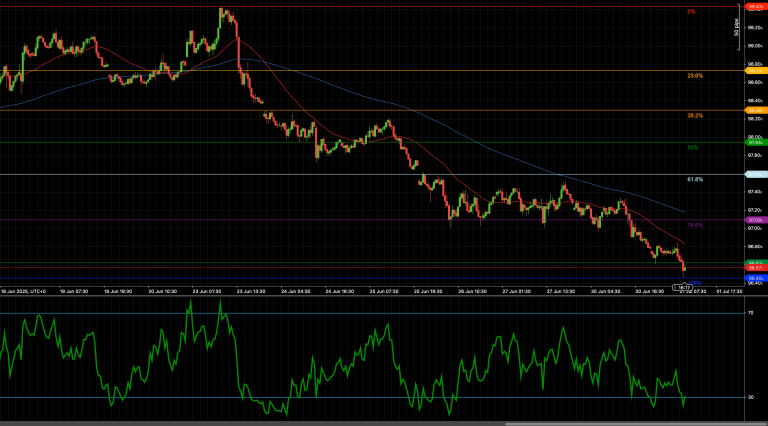
Resistance at 1.3150 is critical for GBP/USD. A successful breach above this level targets subsequent resistance at 1.3200, followed by a longer-term objective around 1.3250. Immediate downside support emerges near 1.3100, closely aligned with recent consolidation lows, followed by significant dynamic support at the 50-period moving average near 1.3060. Further down, key psychological support at 1.3000 remains a solid defensive barrier.
Moving Average Analysis and Dynamic Price Levels
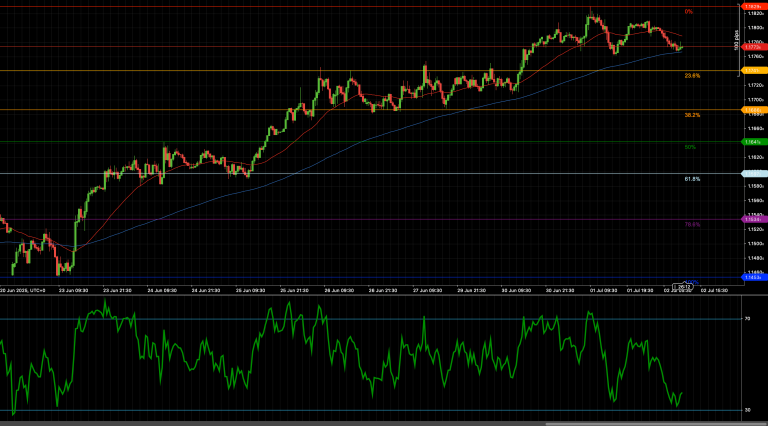
GBP/USD maintains a strong bullish posture, trading above both the 50-period and the 200-period weighted moving averages (WMAs). The 50-WMA provides immediate dynamic support around 1.3060, reinforcing bullish momentum on short-term corrections. The broader bullish trend is underscored by the ascending 200-WMA, indicating solid long-term buying interest. Traders should watch these moving averages closely for signals of continued bullish bias or potential reversals.
RSI Momentum Analysis and Divergence Patterns
The RSI (14-period) currently stands at around 67, indicating robust bullish momentum that is approaching but has not yet entered overbought territory. This level highlights that further upward movements may have room to extend but should be closely monitored for potential divergence or reversals, particularly if RSI fails to match price highs upon any breakout above 1.3150.
Price Action and Candlestick Analysis
Recent candlestick formations indicate steady bullish strength as GBP/USD nears critical resistance at 1.3150. The predominance of bullish candlesticks, with solid bodies and limited bearish shadows, suggests ongoing buying pressure. Traders should look for confirmation through clear bullish engulfing or doji reversal candlesticks near resistance, as these patterns can significantly clarify the next move.
Chart Patterns and Formation Analysis
GBP/USD currently forms an ascending triangle pattern, characterized by clear horizontal resistance at 1.3150 and rising support from recent higher lows. Typically, this bullish continuation pattern suggests potential upward breakout opportunities, opening the path towards higher resistance levels near 1.3200 and possibly 1.3250. Conversely, a downside breakout below ascending support would raise bearish scenarios towards key support areas near 1.3060 and 1.3000.
Fibonacci Retracement Levels and Extension Targets
Applying Fibonacci retracement to the recent bullish wave highlights key supports at the 38.2% retracement (around 1.3080), the 50% retracement (approximately 1.3060), and the 61.8% retracement near 1.3040. On the bullish side, successful clearance above 1.3150 would open Fibonacci extension targets initially at 127.2% near 1.3200 and further at the 161.8% level close to 1.3250.
🔍 MARKET OUTLOOK & TRADING SCENARIOS
Bullish Scenario for GBP/USD
A definitive bullish breakout above resistance at 1.3150 is likely to fuel further advances toward the next key targets at 1.3200 and potentially 1.3250. Positive RSI momentum and supportive moving averages strongly favor this scenario, offering traders attractive entry opportunities following confirmed breakouts.
Neutral Scenario for GBP/USD
Should GBP/USD fail to decisively break resistance at 1.3150 but remain above key short-term supports around 1.3100, the pair may consolidate in a narrow range. This neutral scenario could provide traders with short-term, range-bound trading opportunities, emphasizing tight stop-losses and targeted entry and exit points.
Bearish Scenario for GBP/USD
If GBP/USD encounters strong selling pressure and reverses sharply from 1.3150, a bearish outlook could swiftly develop. Confirmation of bearish sentiment would occur upon breaching support at 1.3100, targeting deeper corrective moves toward dynamic support at the 50-WMA near 1.3060 and psychological support around 1.3000.
💼 TRADING CONSIDERATIONS
Trading GBP/USD at these critical levels demands careful management of risk and strategic positioning. Traders should remain attentive to clear breakout signals, ensuring positions are supported by confirmed technical indicators and candlestick patterns. Protective stop-loss orders placed just beyond key technical levels will minimize risk exposure. Partial profit-taking at significant resistance/support levels and active management of open trades will further enhance trading outcomes.
🏁 CONCLUSION
GBP/USD is testing a critical resistance zone at 1.3150, supported by bullish moving averages and a positive RSI momentum reading. Traders must watch carefully for clear breakout confirmations or potential reversal signals around this pivotal area. Precise entry, disciplined risk management, and strategic exits remain essential to capitalize effectively on evolving market conditions.
⚠️ DISCLAIMER
This analysis is purely informational and does not constitute financial advice. Trading forex involves significant risk. Always consult a professional advisor before making trading decisions.