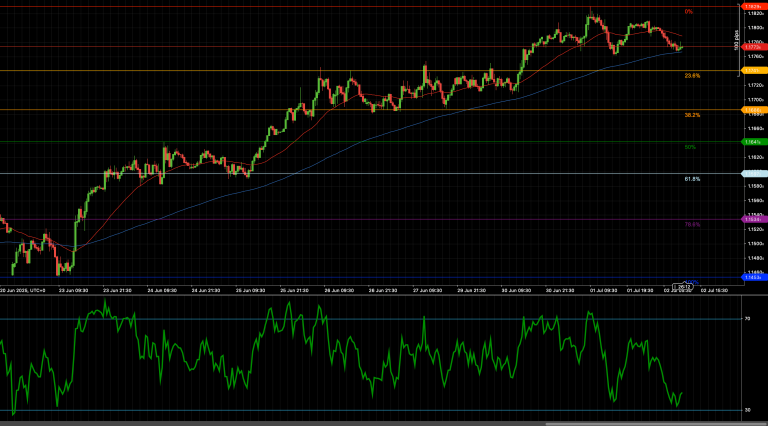
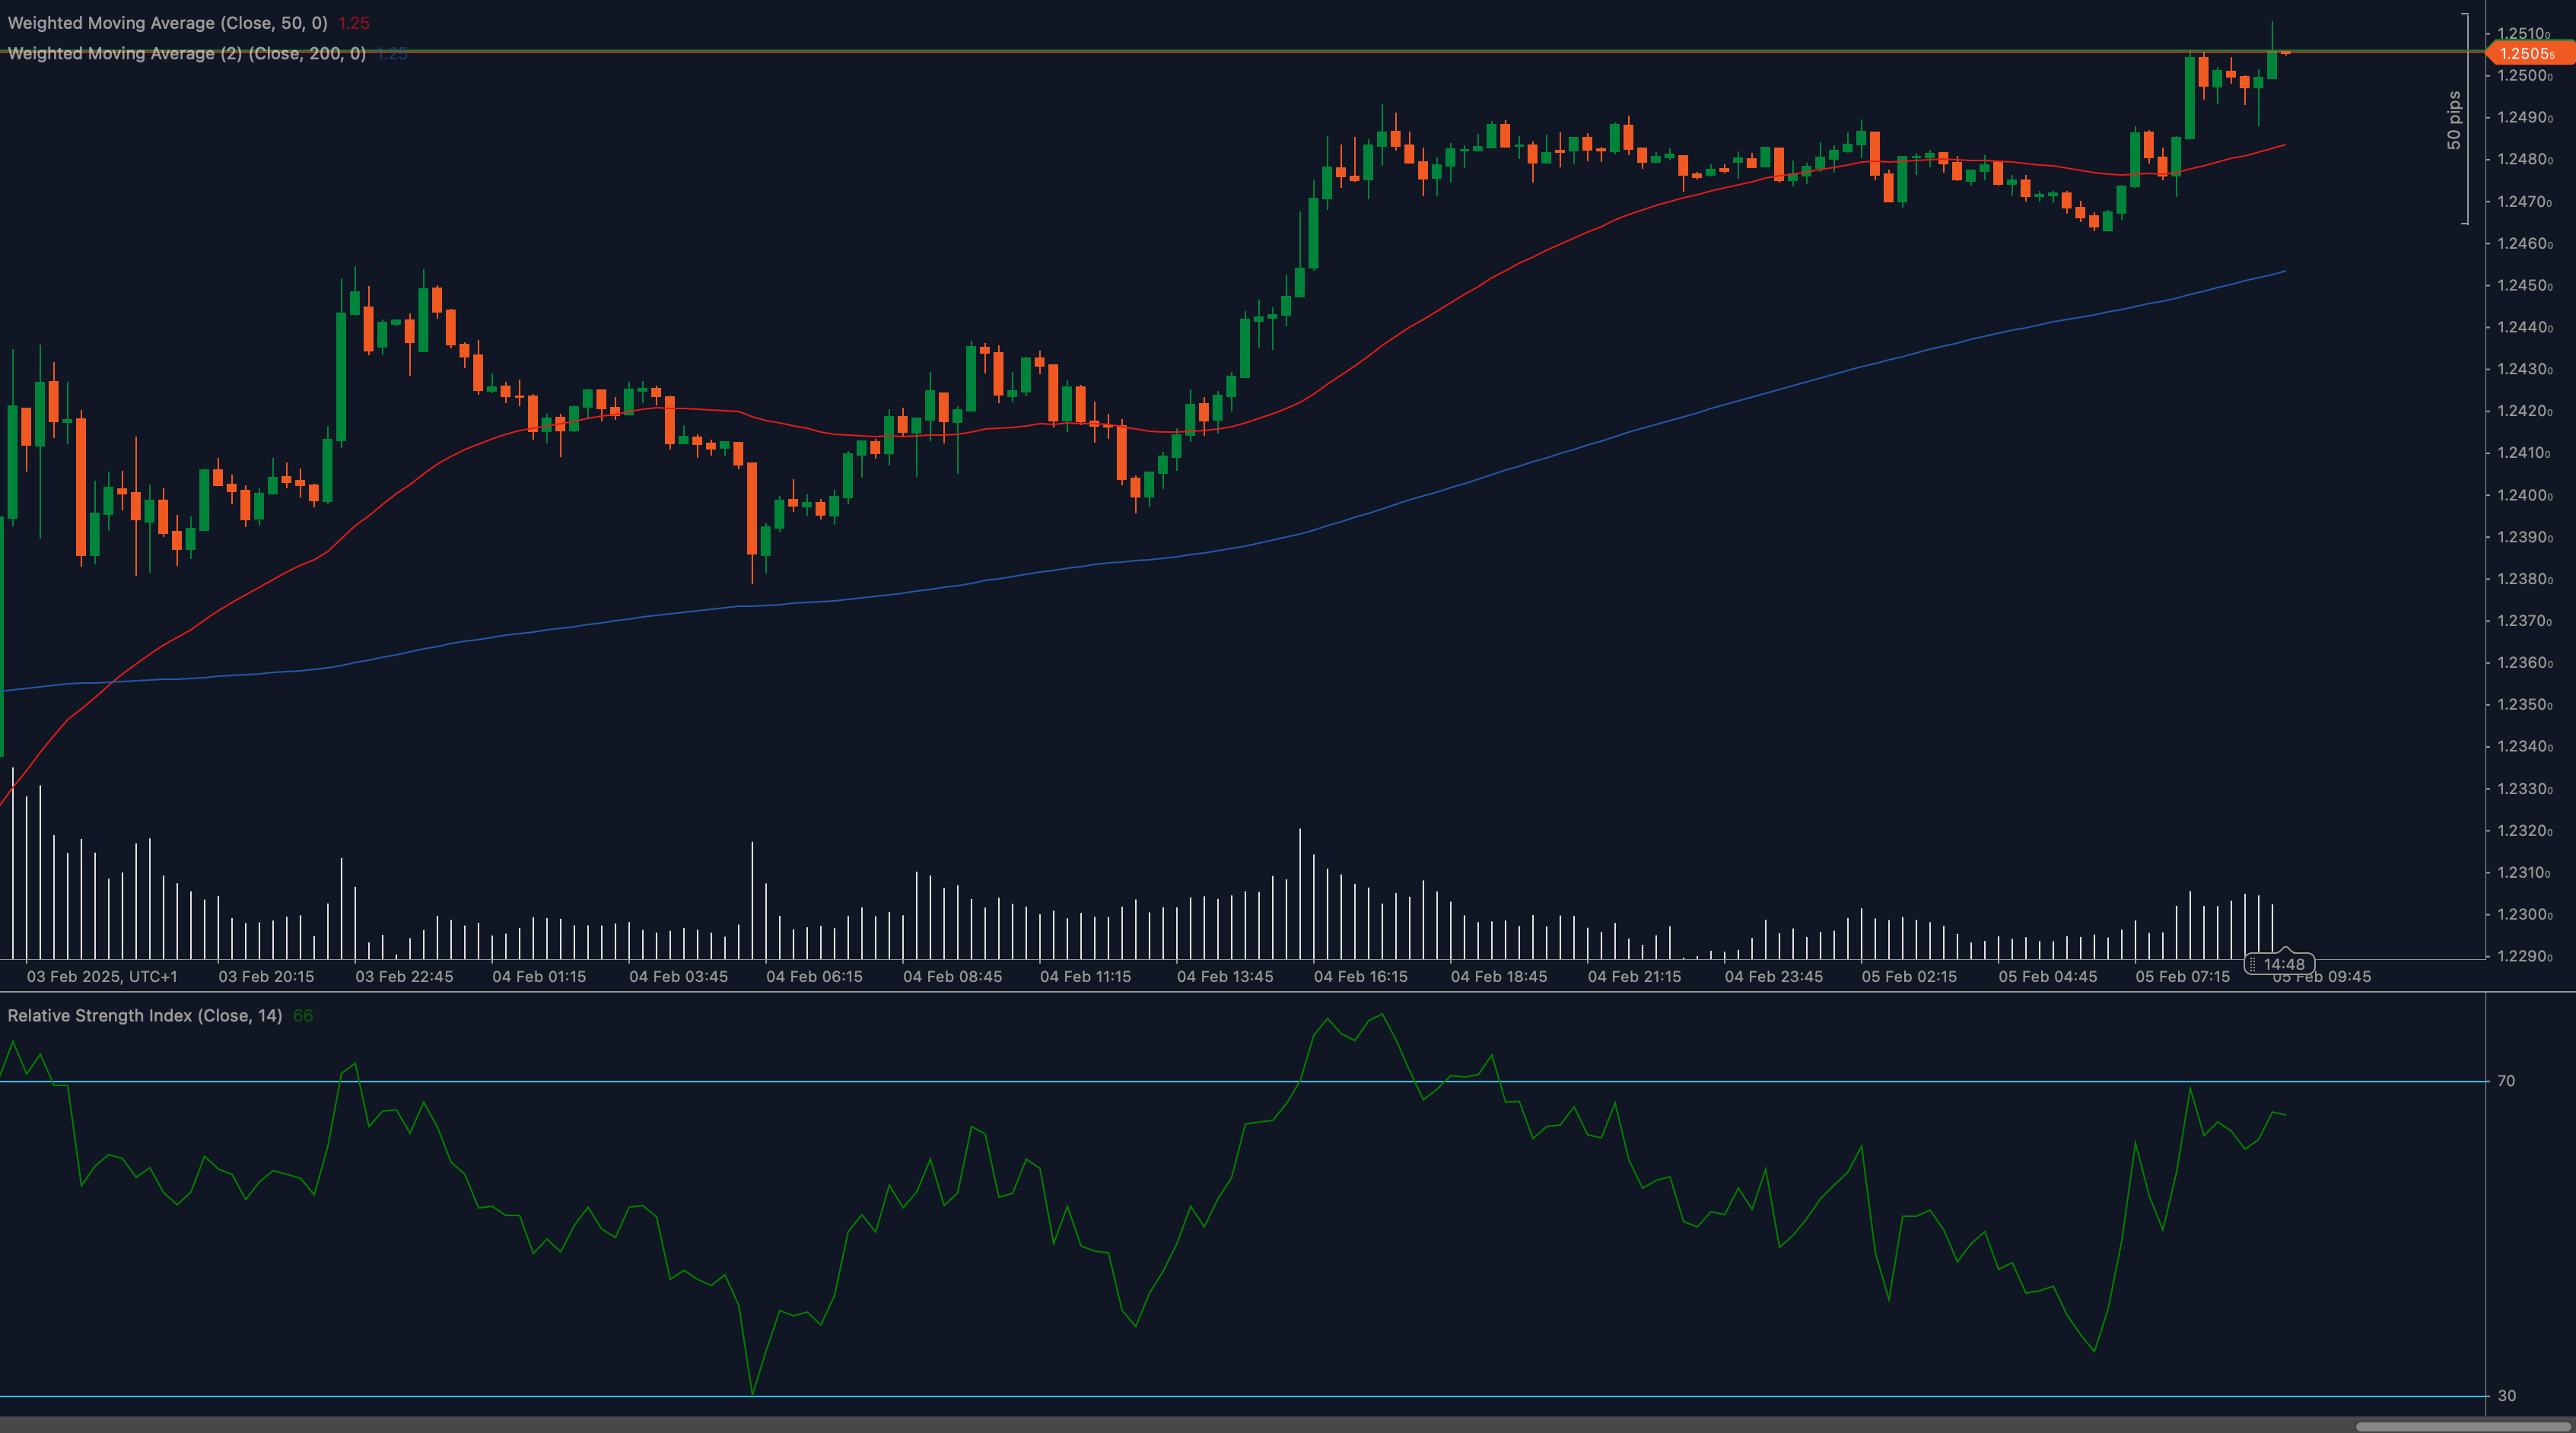
The GBP/USD pair has surged past the 1.2510 resistance level, confirming a bullish breakout. The sustained momentum suggests buyers are in control, but upcoming resistance levels will be crucial in determining the next move.
Technical Analysis
📈 Weighted Moving Averages Support Bullish Trend
The 50 Weighted Moving Average (WMA) at 1.25 remains above the 200 WMA, reinforcing the uptrend. As long as GBP/USD holds above this zone, the bullish momentum remains intact.
📊 RSI Indicates Strong Momentum
The Relative Strength Index (RSI) is at 66, nearing overbought conditions. If RSI moves above 70, it could indicate potential exhaustion, leading to a pullback before further upside.
🔎 Resistance and Support Levels in Focus
With GBP/USD pushing higher, traders are watching the next resistance zones closely.
Key Levels to Watch
Support Levels:
- 1.2510: Now acting as a support after the breakout.
- 1.2480: A stronger support area if a pullback occurs.
Resistance Levels:
- 1.2530: Immediate resistance where profit-taking may emerge.
- 1.2560: Key level to confirm further upside potential.
Fundamental Drivers
GBP/USD remains influenced by interest rate expectations, economic data, and US dollar sentiment. The pound is gaining strength amid market optimism, while traders await key US economic data and Bank of England commentary for further direction.
Outlook
As long as GBP/USD stays above 1.2510, the bullish trend remains in play, with potential upside toward 1.2530 and 1.2560. A break back below 1.2510 could trigger a pullback toward 1.2480 before resuming the uptrend.
Traders should monitor price reactions at resistance levels and stay updated on key economic events that could impact market sentiment.