📊 MARKET OVERVIEW
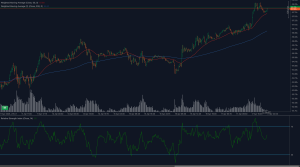
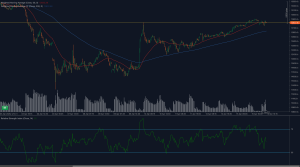
Brent Crude (UKOIL) experienced a strong upward surge, lifting from sub-$64.00 levels to challenge the key resistance near $68.90. This level represents a psychological and structural cap that halted upward momentum in recent sessions. Price currently holds above both short- and long-term moving averages, maintaining a bullish bias overall.
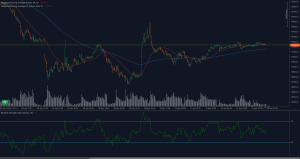
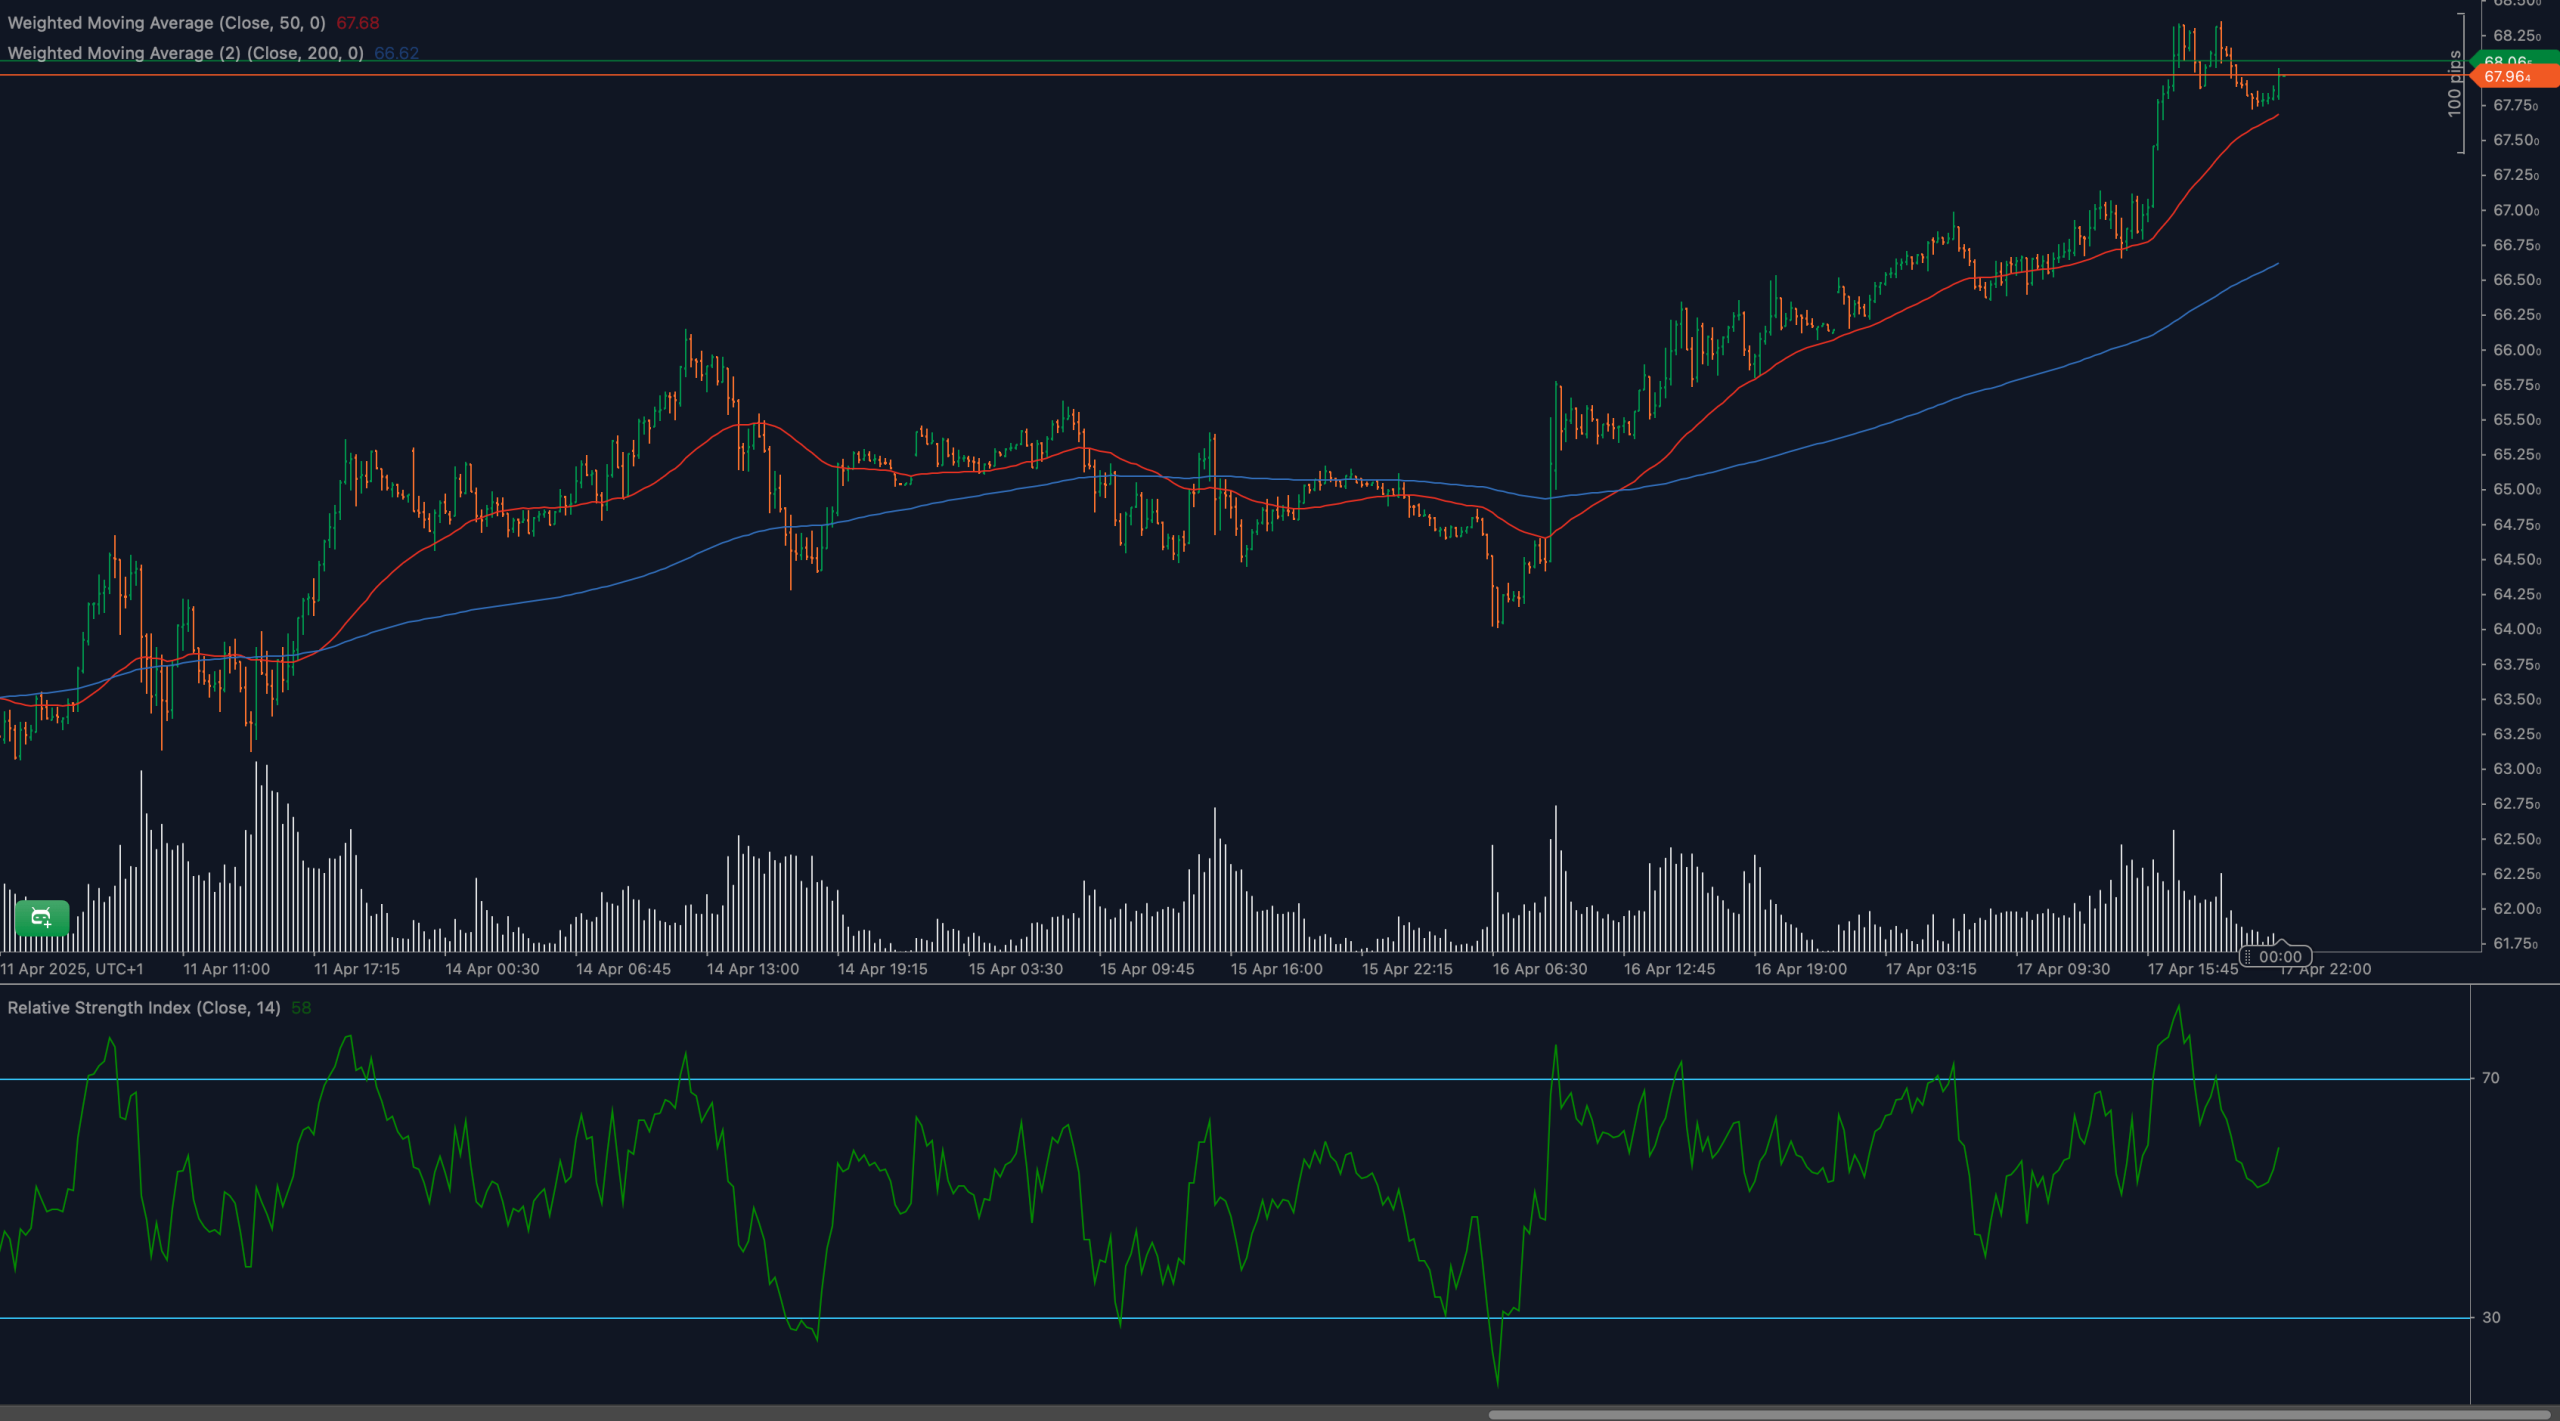
However, the rally has paused, with momentum indicators showing early signs of fatigue. Volume has contracted as the market approaches resistance, and RSI has pulled back from near overbought territory. These signs suggest buyers may be hesitating as they assess the strength of the move. The next few sessions will likely decide whether UKOIL breaks higher or enters consolidation.
📈 TECHNICAL ANALYSIS
What Are the Key Support and Resistance Levels for UKOIL?
Resistance stands firmly at $68.90, the recent high and structural ceiling. A confirmed breakout above this level opens upside toward $69.60 and potentially $70.20. On the downside, initial support rests at $67.50, followed by a more critical level at $66.80 — a previous breakout zone and minor Fibonacci cluster.
Moving Average Analysis and Dynamic Price Levels
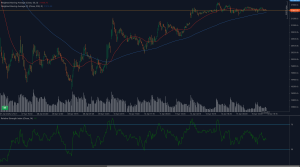
UKOIL remains above both the 50-period WMA ($67.68) and the 200-period WMA ($66.92), with both moving averages sloping upward. This alignment reflects a continuation of bullish sentiment. The 50-WMA is especially relevant as short-term dynamic support, currently aligned with minor consolidation lows. These moving averages form a support base unless price decisively breaks below $67.00.
RSI Momentum Analysis and Divergence Patterns
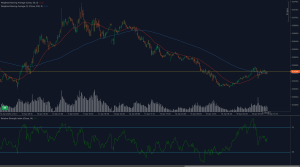
The 14-period RSI recently climbed into overbought territory above 70 but has since rolled back to 58, reflecting reduced bullish strength. This retreat signals early caution among buyers. There is no confirmed bearish divergence, but the RSI’s inability to hold above 70 shows weakening conviction. A move below 50 could confirm a shift to neutral-to-bearish sentiment.
Price Action and Candlestick Analysis
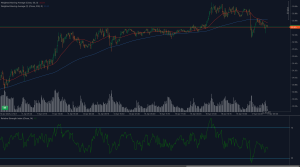
The rally toward $68.90 was sharp, but recent candles near this level show long upper wicks and small real bodies, suggesting exhaustion and possible rejection. No confirmed reversal patterns are in place yet, but indecision at this critical resistance could lead to volatility. A strong bullish breakout candle or a bearish engulfing formation will be decisive in guiding short-term direction.
Chart Patterns and Formation Analysis
There are early signs of a flagging formation or short-term rising wedge after the impulsive leg toward $68.90. If confirmed, this would suggest a bullish continuation pattern, contingent on a clean breakout above resistance. If instead the wedge breaks lower, it may signal the beginning of a retracement phase, likely toward $67.50 or lower.
Fibonacci Retracement Levels and Extension Targets
Using the recent low at $64.00 and the high at $68.90, the 38.2% retracement lies at $67.00, while the 50% retracement aligns with $66.45. These levels are strong support if the rally fails to extend. If UKOIL breaks higher, Fibonacci extensions project upside targets near $69.60 (127.2%) and $70.20 (161.8%).
🔍 MARKET OUTLOOK & TRADING SCENARIOS
Bullish Scenario for UKOIL
A clean breakout above $68.90, especially on increasing volume and RSI returning above 65–70, would signal bullish continuation. In that case, $69.60 and $70.20 become the next natural targets. Momentum and candlestick confirmation will be essential for validating breakout trades.
Neutral Scenario for UKOIL
If price remains trapped between $67.50–$68.90, the market may consolidate. RSI holding between 50 and 60 supports a neutral stance. This range could favor mean-reversion or short-term swing strategies until a breakout emerges.
Bearish Scenario for UKOIL
Failure to break $68.90, followed by a decline below $67.50, would favor a bearish retracement. RSI slipping under 50 and price closing below the 50-WMA would confirm weakness. Downside targets would then include $66.80 and $66.45.
💼 TRADING CONSIDERATIONS
Traders seeking long positions should wait for a confirmed breakout above $68.90, ideally supported by volume and RSI strength. Entries above $69.00 could target $69.60 and $70.20, with stops near $68.40.
For short setups, look for failure at $68.90 and break below $67.50, confirmed by weakening RSI and volume patterns. Shorts could target $66.80 and $66.45, using tight stop-losses above $68.60 to manage risk.
🏁 CONCLUSION
UKOIL is stalling beneath a key resistance zone at $68.90 after a sharp rally. While the uptrend remains technically intact with support from moving averages, momentum has cooled and price action near resistance suggests hesitation. Traders should remain alert for either a clean breakout or reversal confirmation, with clear technical levels to guide both bullish and bearish scenarios.
⚠️ DISCLAIMER
This analysis is for informational purposes only and does not constitute financial or investment advice. Trading involves substantial risk, and you should consult with a professional before making trading decisions.