
📊 MARKET OVERVIEW
XAU/USD has found temporary relief after tumbling to 3352, rebounding from the 78.6% Fibonacci retracement of the late May–early June rally. This corrective bounce comes amid broader profit-taking and position rebalancing, yet it faces immediate headwinds just beneath 3354.9, where both Fibonacci structure and moving average congestion limit follow-through. The sharp drop from 3372.5 reinforces the bearish momentum that dominated early June price action, and the current rebound still lacks the structural strength to confirm a bullish reversal. Although RSI has climbed out of oversold territory, indicating reduced downside momentum, buyers remain cautious given the rejection zone overhead and the absence of clear continuation signals.
📈 TECHNICAL ANALYSIS
Key Support and Resistance Levels
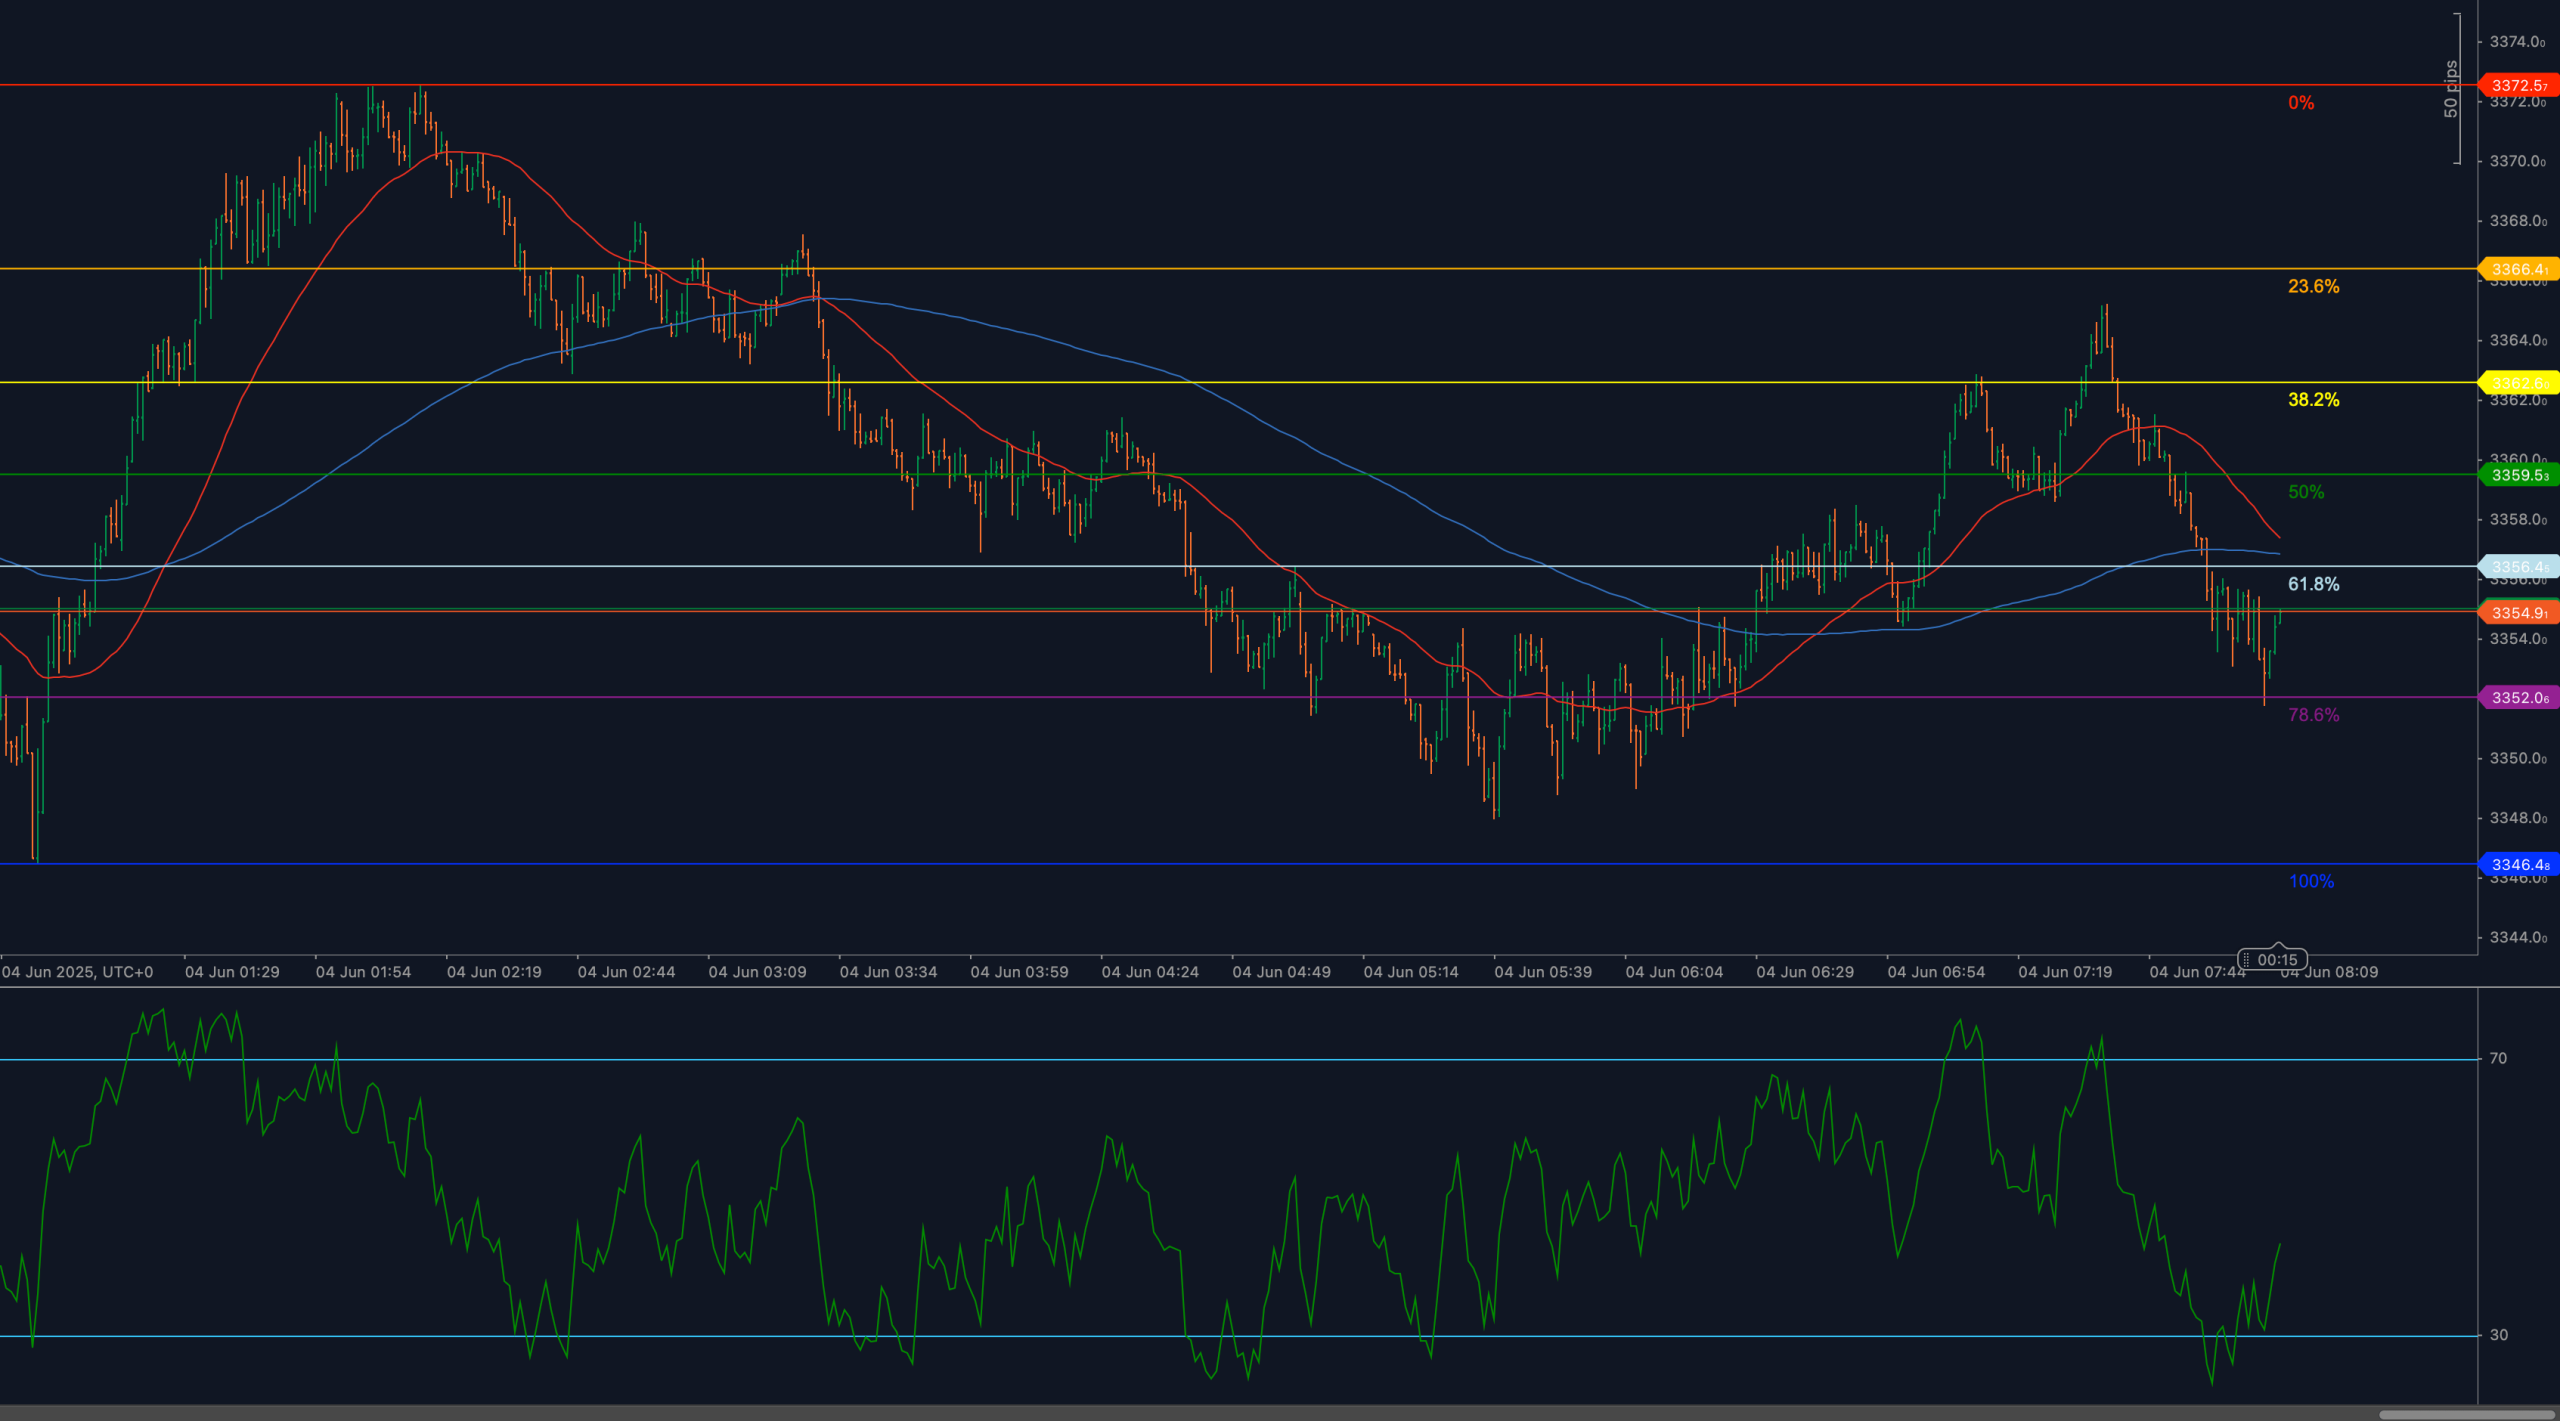
Price is currently capped beneath 3354.9, a pivotal intraday resistance that aligns closely with prior breakdown structure and the lower edge of the 61.8% Fibonacci retracement zone. A clean break above this level would pave the way for a deeper retracement toward 3359.6 and 3366.4, corresponding to the 50% and 38.2% retracement levels respectively. On the downside, support at 3352 remains the key zone to watch — this level marked the exact 78.6% Fibonacci retracement and halted the sharp morning decline. A breakdown below 3352 would immediately expose the psychological support at 3346.4, the full retracement of the previous impulsive leg. If this floor gives way, bearish pressure could intensify significantly, potentially triggering trend continuation lower into new corrective zones.
Moving Averages and Dynamic Price Action
Gold is trading beneath both the 50-period and 200-period weighted moving averages on the hourly chart, reinforcing the current bearish bias. The 50-WMA has already crossed below the 200-WMA, suggesting a momentum shift toward deeper correction rather than consolidation. The 200-WMA currently rests just below the 61.8% Fibonacci level near 3354.9, acting as a strong ceiling that price has failed to close above in several attempts. If bulls cannot reclaim this moving average pocket, rallies are likely to face consistent rejection. Conversely, a reclaim of this dynamic zone would be the first indication that the rebound off 3352 has structural potential.
RSI Momentum and Bearish Pressure
The 14-period RSI has bounced from a deeply oversold level near 30 and is now climbing toward neutral territory, currently trading around 45. This momentum recovery is notable but still insufficient to confirm a reversal. Bulls would need to see a sustained break above 50 to signal momentum shift and higher follow-through potential. Until then, RSI’s behavior reflects technical stabilization rather than trend reversal. Should RSI fail to reclaim 50 and roll over again, it may align with renewed pressure toward 3352 and lower.
Candlestick Behavior and Price Action Clarity
Recent candles reflect an uncertain rebound rather than a decisive bottom. Although the rejection from 3352 created a brief bullish wick, follow-through remains weak, and upper shadows near 3354.9 signal persistent resistance. Candle bodies remain relatively narrow, suggesting low conviction and the absence of sustained buyer interest. A strong bullish engulfing pattern or impulsive candle above 3354.9 would be needed to validate recovery potential. Until that materializes, current price action favors range-bound chop with downside risk prevailing.
Chart Structure and Breakdown Formation
The broader chart structure reflects a controlled breakdown from 3372.5, followed by a corrective bounce that has yet to regain lost ground. The move resembles a classic pullback toward prior support-turned-resistance, with 3354.9 now serving as the structural pivot. Unless price clears this level decisively, the current leg appears to be a retest rather than a new bullish leg. If sellers defend this level and RSI stalls below 50, the likelihood of a deeper retracement below 3352 increases significantly. Bulls remain on the defensive and need to deliver a strong higher low formation before broader sentiment can shift.
Fibonacci Retracement and Extension Levels
The Fibonacci retracement measured from 3346.4 (June 4 low) to 3372.5 (June 4 high) defines the current corrective wave. The 61.8% retracement level at 3354.9 has become the immediate resistance zone, capping the current rebound. Below price, the 78.6% level at 3352 is acting as support, marking the final major retracement before full cycle reversal. A failure at 3352 would open the path to 3346.4, completing the retracement. On the upside, a breakout above 3354.9 would bring 3359.6 (50% level) and 3366.4 (38.2%) into view, which aligns with dynamic moving average zones. A push toward 3372.5 would require bullish confirmation via momentum and volume.
🔍 MARKET OUTLOOK & TRADING SCENARIOS
Bullish Scenario
A clean break and close above 3354.9, paired with RSI reclaiming 50, would signal bullish reengagement. In this case, upside targets include 3359.6, 3366.4, and potentially 3372.5 if follow-through accelerates.
Neutral Scenario
Sideways consolidation between 3352 and 3354.9 with RSI stuck in the 45–50 range would suggest market indecision. This could persist until new catalyst-driven movement emerges.
Bearish Scenario
A rejection at 3354.9 followed by a breakdown below 3352 would expose 3346.4 and trigger renewed bearish pressure. If RSI rolls over before reclaiming 50, this scenario gains greater validity.
💼 TRADING CONSIDERATIONS
Bearish bias remains active beneath 3354.9, with rejection patterns and RSI stalling as key signals. Short setups may target 3352 initially, followed by 3346.4. Bulls must await confirmed breakout above 3354.9 with momentum support before initiating recovery positions.
🏁 CONCLUSION
XAU/USD is stabilizing above 3352 following an impulsive selloff, but resistance at 3354.9 continues to limit any meaningful recovery. RSI is recovering from oversold, yet remains below the midline. Until price reclaims lost ground and confirms with bullish follow-through, downside continuation remains a valid risk scenario.
⚠️ DISCLAIMER
This analysis is for informational purposes only and does not constitute financial advice. Always consult with a licensed financial professional before making trading decisions.


