
📊 Market Overview
The XAUUSD has navigated a period of intense volatility, marked by a powerful surge to a peak near 3895.0 on October 1st, followed by an aggressive sell-off that found a floor around the 3815.0 level. The precious metal is currently locked in a tight consolidation phase, battling a significant resistance confluence formed by a horizontal price level and the 200-period Weighted Moving Average (WMA), leaving traders on high alert for the next directional move.
After the sharp profit-taking event erased a significant portion of the prior gains, buyers re-emerged, pushing the price up from the October 2nd lows. However, this recovery has stalled, and XAUUSD is now coiling below a critical technical ceiling, indicating a period of market indecision as bulls and bears fight for control.
📈 Technical Analysis
Key Support and Resistance Levels
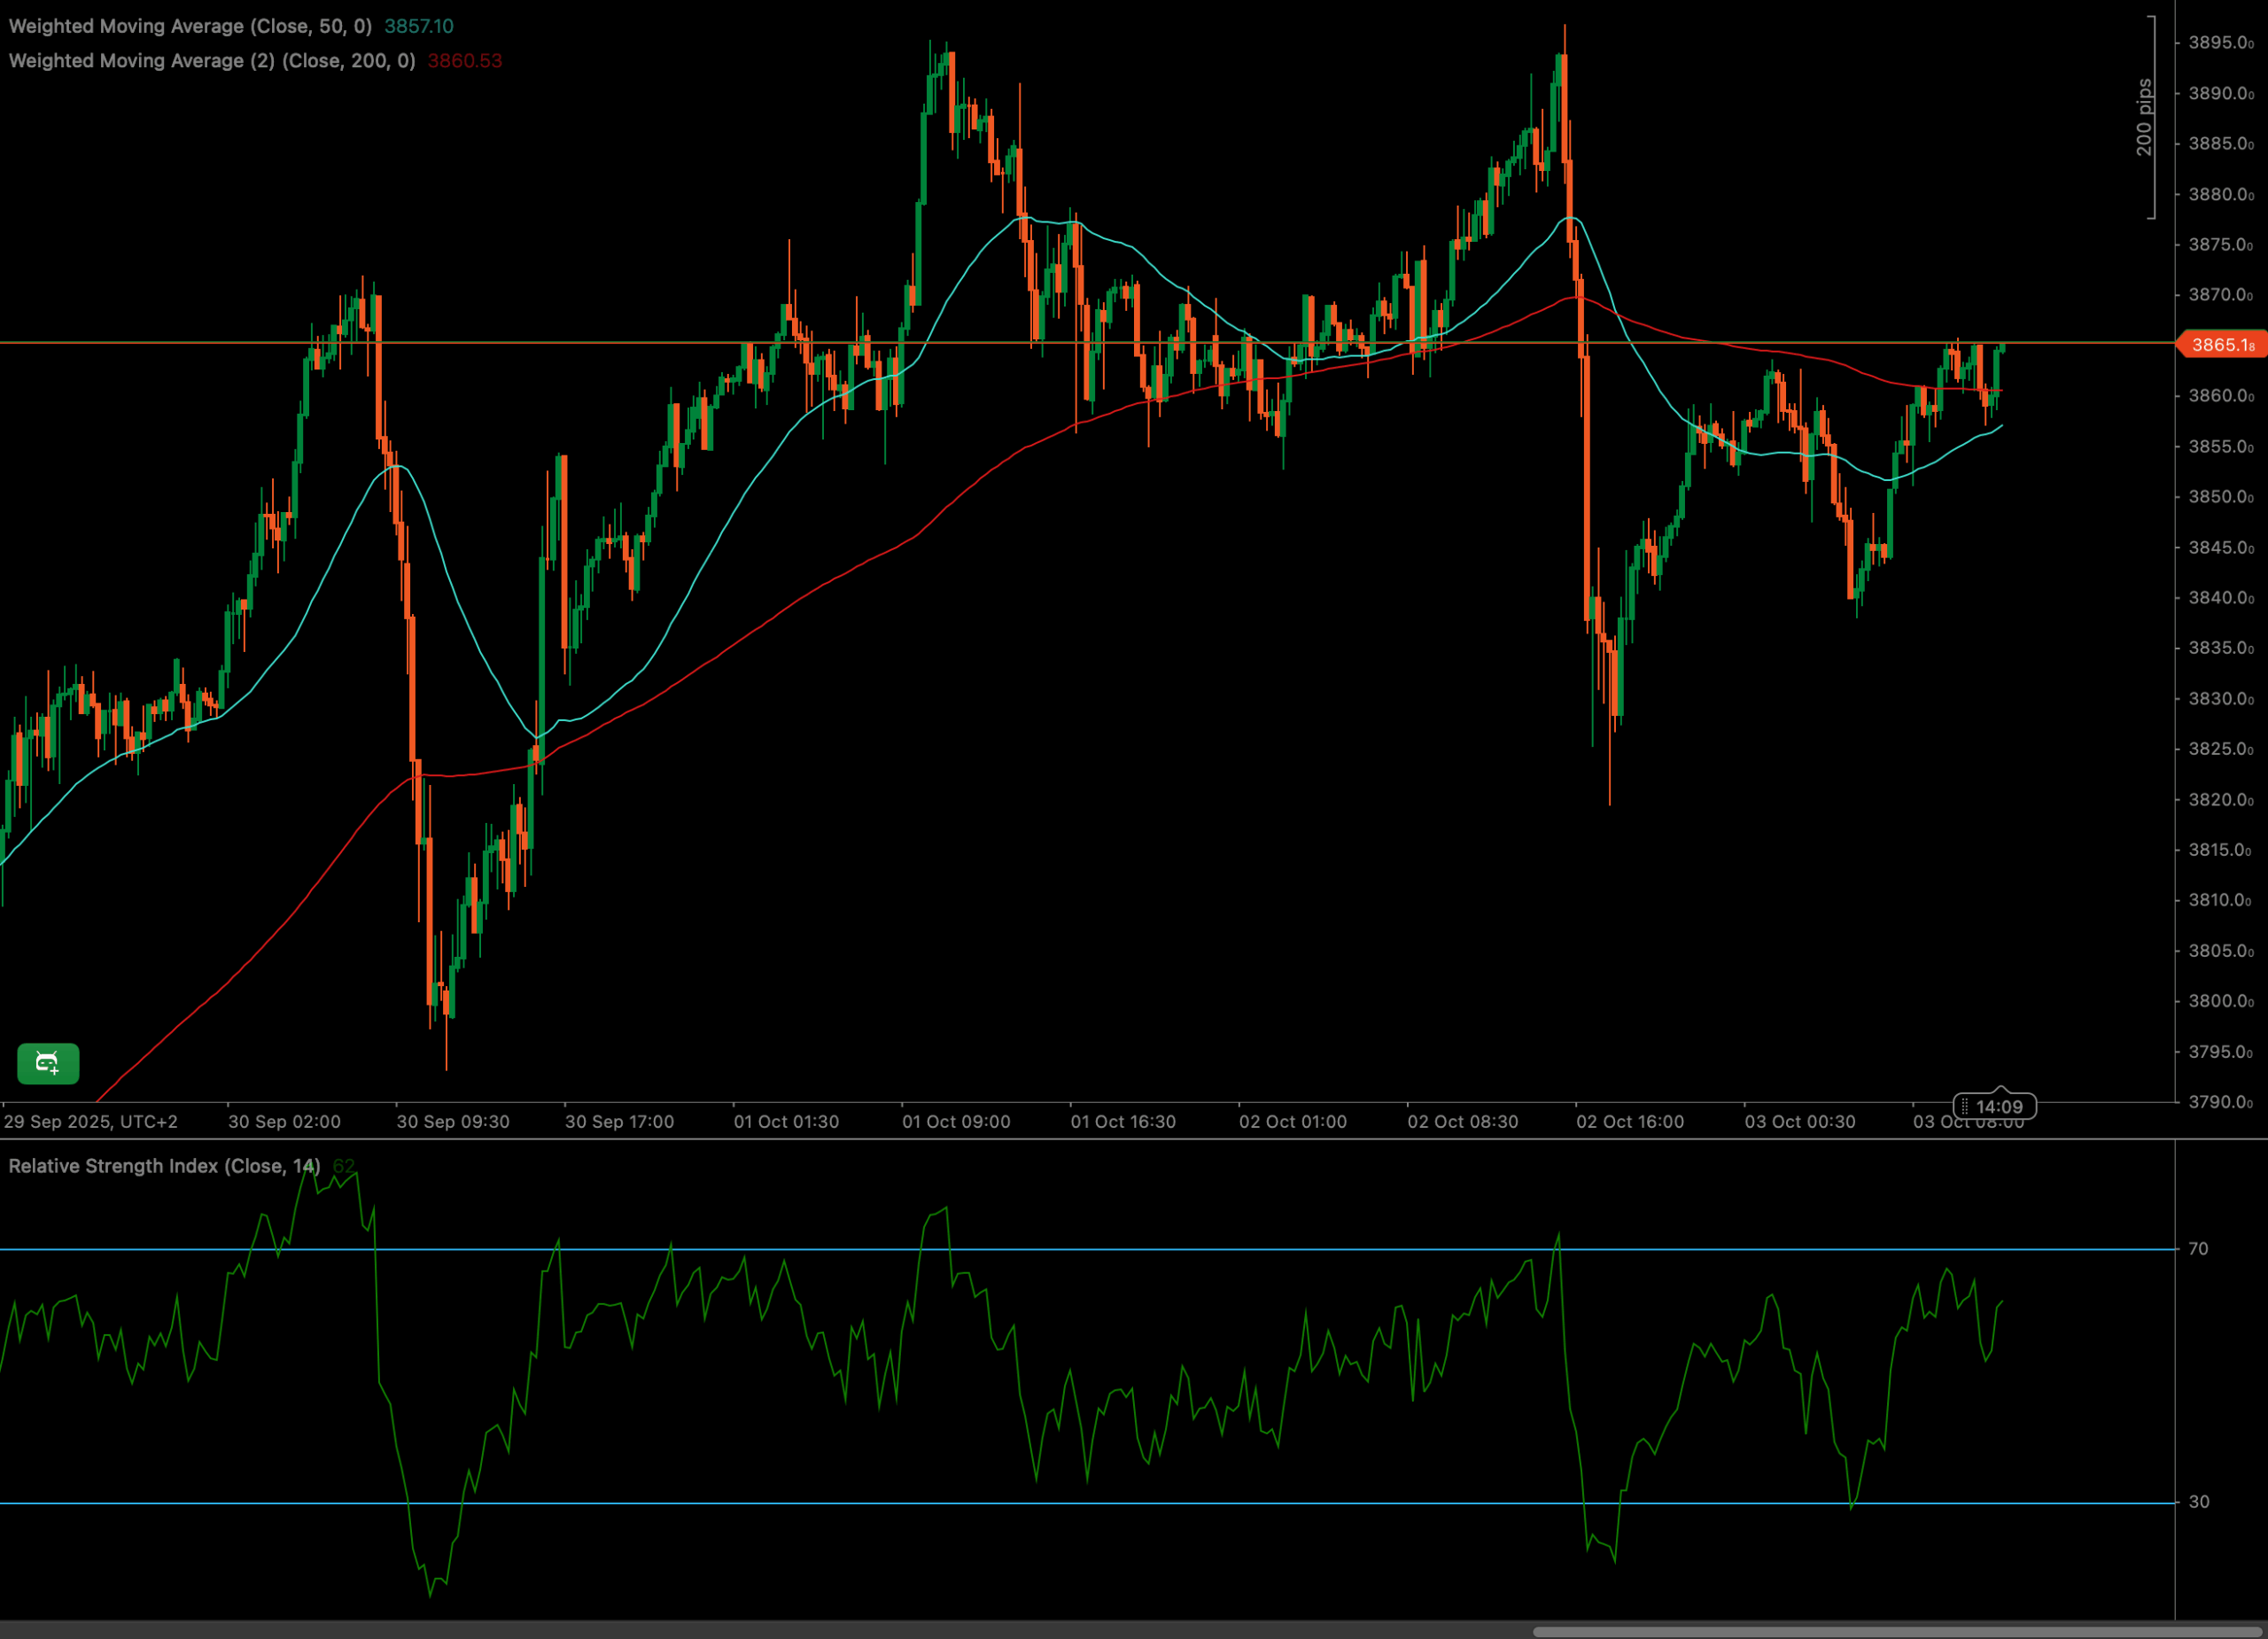
The immediate and most critical resistance for XAUUSD is located at approximately 3865.1, a level that is reinforced by the presence of the 200-period WMA. A breakout above this zone is required to confirm further bullish intent. On the downside, the 50-period WMA offers initial dynamic support around 3857.0, with a more established support area visible near the 3835.0-3840.0 consolidation zone.
Moving Average Analysis for XAUUSD
The moving averages tell a story of shifting momentum. After the sharp decline on September 30th, the 50 WMA (cyan line) crossed below the 200 WMA (red line), signaling a bearish shift. However, the subsequent recovery saw the 50 WMA cross back above the 200 WMA. Currently, the price is struggling beneath the 200 WMA, treating it as firm resistance. This configuration highlights the current indecision, with the price action being squeezed between the two moving averages. The 200 WMA is the primary hurdle for bulls to overcome.
RSI and Momentum Shift in XAUUSD
The Relative Strength Index (RSI) visually confirms the recent price action. The indicator plunged towards the oversold 30 level during the sharp sell-off on October 2nd, accurately pinpointing the moment of maximum bearish exhaustion before the price rebounded. The RSI has since recovered to a neutral position, around the 50-60 range. This gives it ample room to move in either direction and does not signal an overbought condition, suggesting that bulls have the potential energy for a breakout if resistance is cleared.
Volume Spike and Market Participation
While specific volume data is not visible on this chart, the sharp price movements on October 1st and 2nd were likely accompanied by high volume. A surge in volume on a breakout above the 3865.1 resistance would add significant credibility to a bullish continuation. Conversely, a rejection from this level with increasing sell-side volume would signal that bears are regaining control.
Candlestick Tone and Market Reaction for XAUUSD
The candlestick patterns highlight the market’s narrative. The peak on October 1st was marked by a large bearish (orange) candle, confirming a strong reversal. At the lows near 3815.0, candles with long lower wicks appeared, indicating buying pressure absorbed the selling. The most recent price action consists of small-bodied candles (dojis and spinning tops) right below the 200 WMA, a classic sign of consolidation and indecision at a critical resistance level.
🔍 Market Outlook & Trading Scenarios
Bullish Scenario
If buyers can force a sustained break and close above the 3865.1 resistance and the 200 WMA, this would signal a continuation of the recovery. The next logical targets would be the 3875.0 area, followed by a potential retest of the highs near 3895.0.
Neutral Scenario
The XAUUSD could remain range-bound between the support at the 50 WMA (around 3857.0) and the resistance at 3865.1. This sideways movement would reflect continued market indecision as traders await a fundamental catalyst or a technical breakout.
Bearish Scenario
A firm rejection from the 3865.1 resistance level, confirmed by a break below the 50 WMA and the support zone around 3840.0, would invalidate the bullish recovery attempt. This could lead to a decline back towards the major lows around 3815.0.
💼 Trading Considerations
- Bullish setup: Look for a decisive candlestick close above the 200 WMA and the 3865.1 resistance level on significant volume. An entry on a successful retest of this level as new support could be considered.
- Breakout setup: A clear break above 3865.1 signals a potential long entry. Conversely, a convincing break below the recent consolidation lows around 3840.0 could signal a short entry.
- Bearish setup: Watch for bearish reversal patterns, such as an engulfing candle or a pin bar, forming at the 3865.1 resistance. A confirmed rejection could offer short opportunities targeting the 3840.0 and 3815.0 support levels.
🏁 Conclusion
The XAUUSD is at a critical technical inflection point. The battle lines are clearly drawn at the 3865.1 resistance, which is heavily fortified by the 200-period WMA. The outcome of this confrontation will likely determine the near-term directional bias for gold. While the RSI has reset from oversold levels, providing room for upside, the price action shows clear hesitation.
Traders should exercise patience and wait for a confirmed breakout or breakdown from the current tight range. A move above 3865.1 would put bulls back in control, while a failure to break this level could see sellers re-emerge and push the price lower.
⚠️ Disclaimer
This analysis is for informational purposes only and does not constitute financial advice. Always consult a licensed financial advisor before making trading decisions.


