
📊 MARKET OVERVIEW
Gold (XAUUSD) continues to demonstrate resilience as prices consolidate above the psychological 2990 level and the critical 50-day moving average. Looking at the chart, we can see a period of consolidation after gold’s impressive rally earlier this year, with prices now testing key technical levels that could determine the next directional move. The broader market context remains supportive for gold, with global economic uncertainties and central bank policies creating an environment where investors are seeking safe-haven assets.
📈 TECHNICAL ANALYSIS
What Are the Key Support and Resistance Levels for XAUUSD?
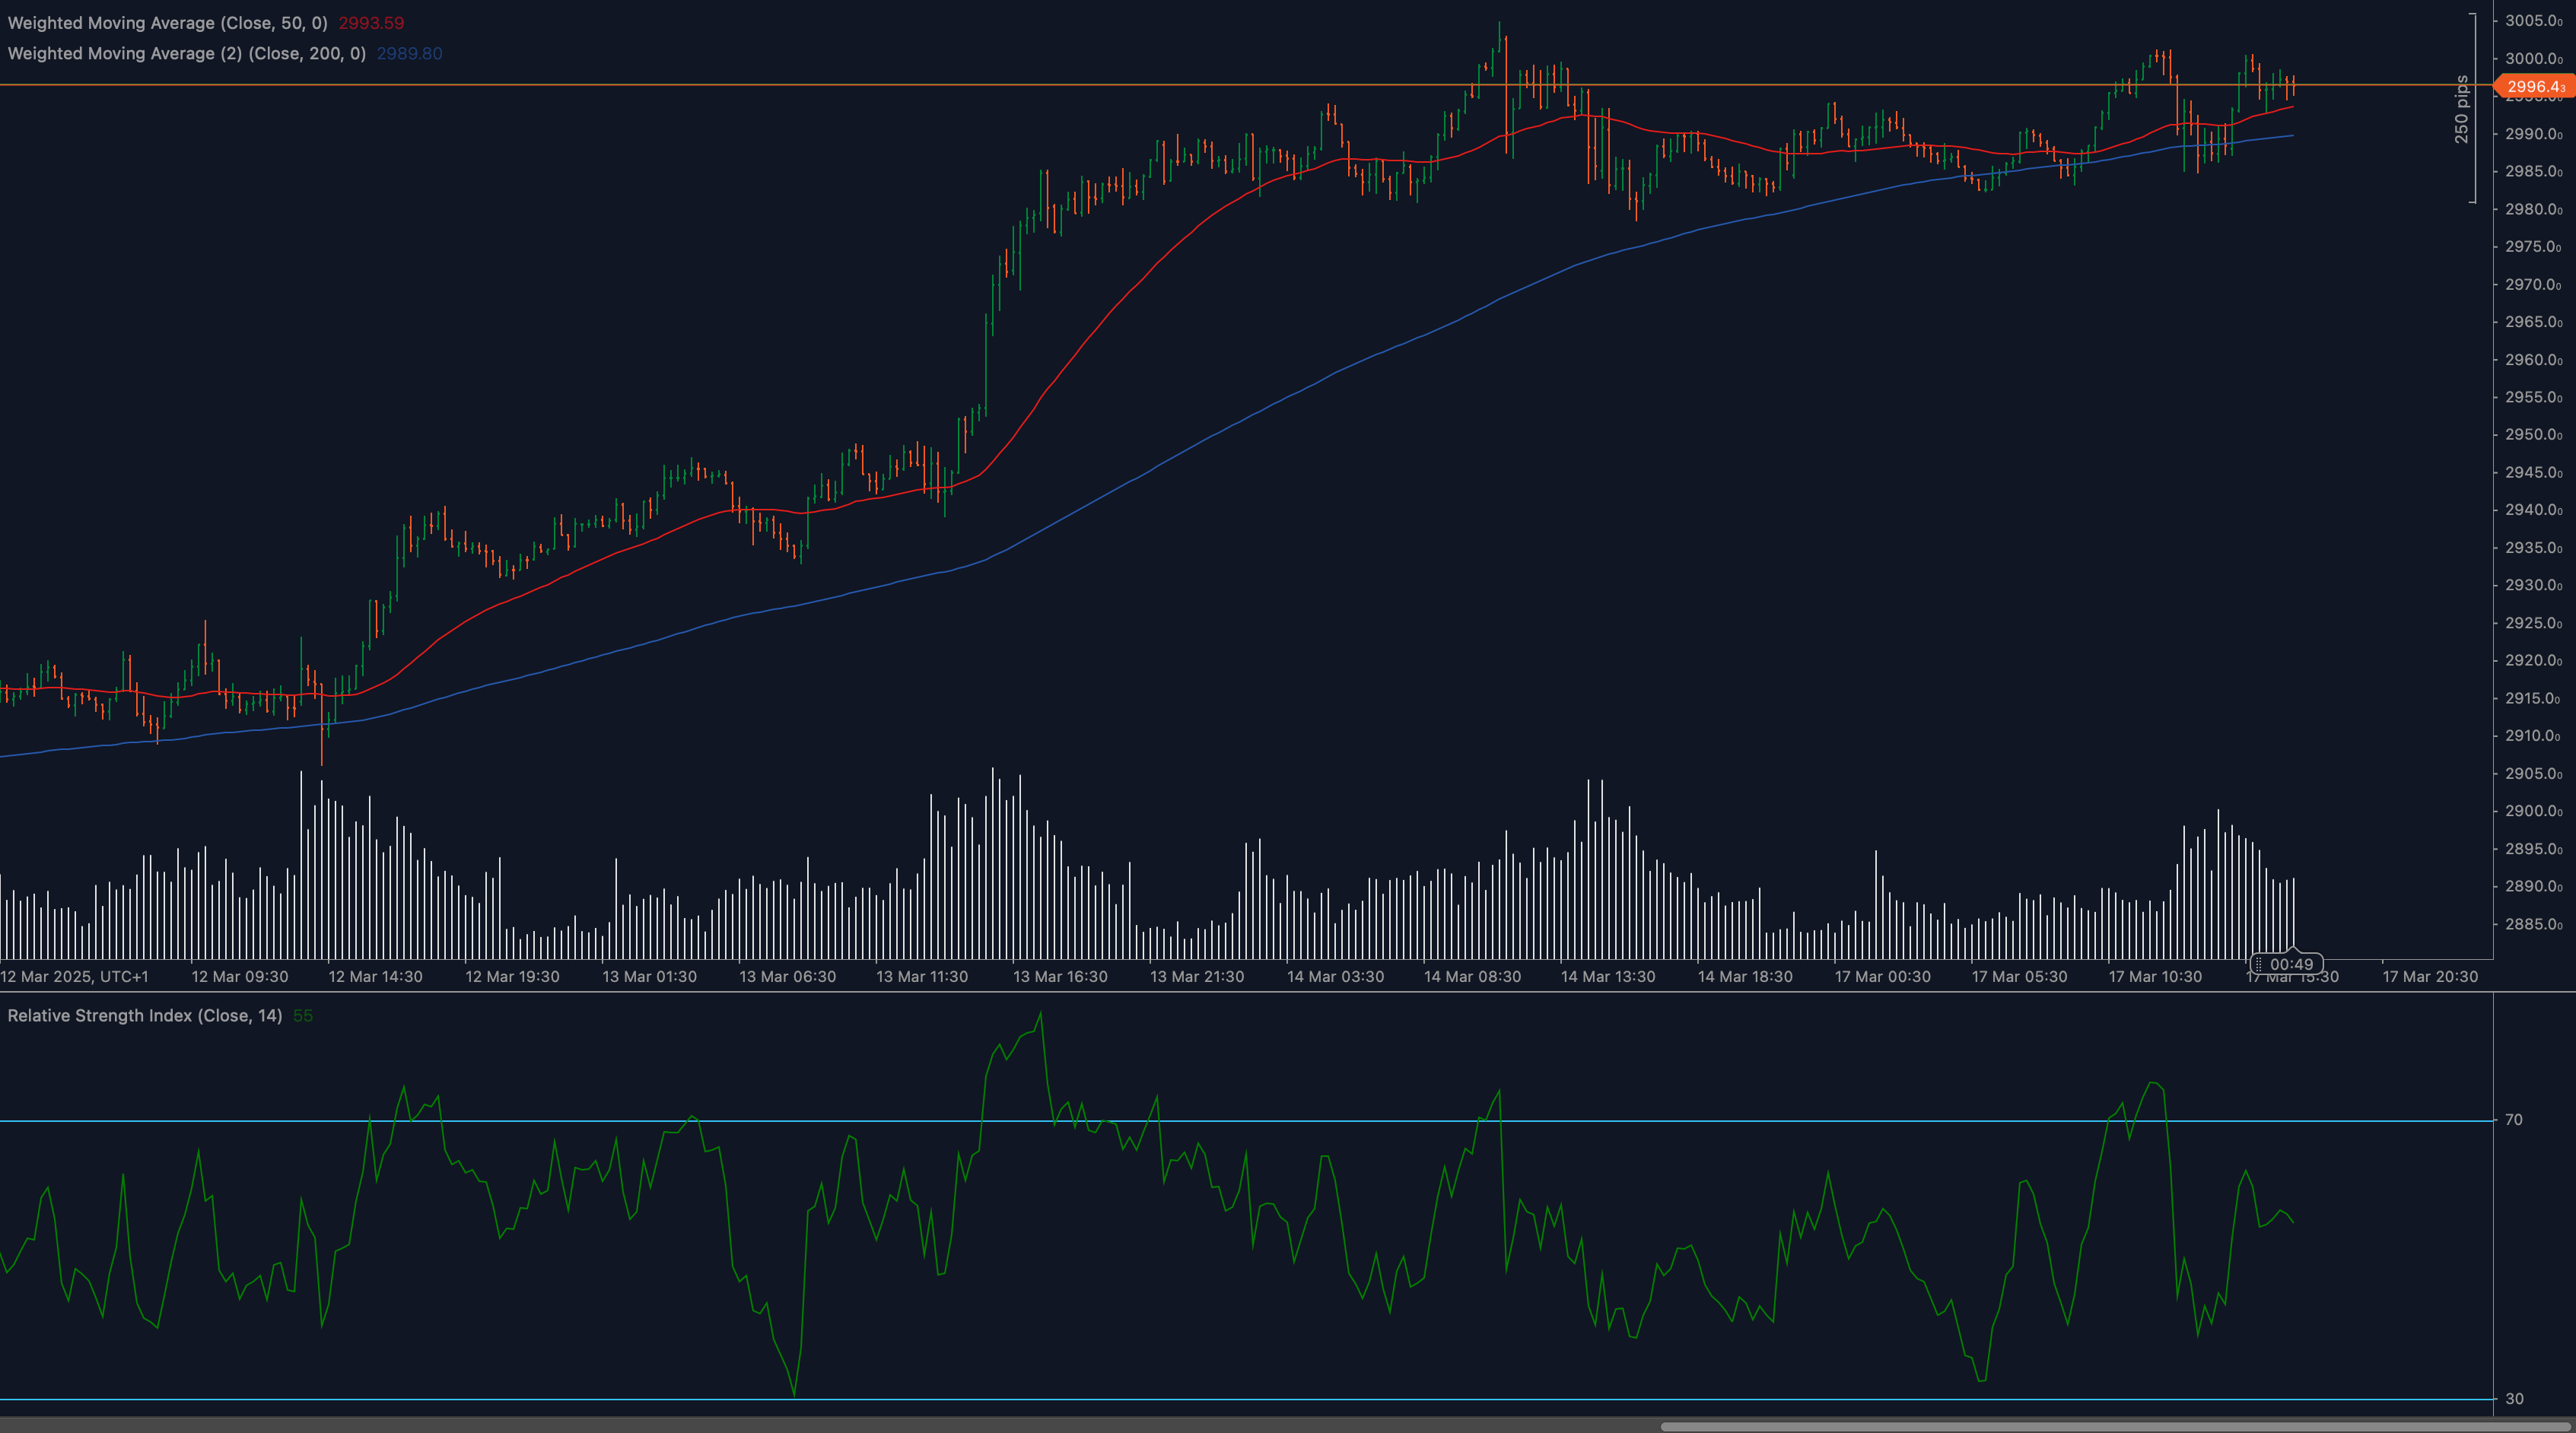
The most immediate support for gold can be found at the 2990 level, which coincides with the 50-day moving average (red line on the chart). This level has been tested several times during the recent trading sessions and has held firm, suggesting strong buying interest. Below this, the next significant support lies around the 2950-2960 zone, where previous consolidation took place.
On the resistance side, the immediate barrier is at the psychological 3000 mark, followed by the recent swing high at approximately 3010-3015. A decisive break above this zone could trigger a new leg higher, potentially targeting the 3050 area. The price action around these levels will be crucial for determining gold’s short-term direction.
Moving Average Analysis and Dynamic Price Levels
The chart clearly shows gold trading above both its 50-day (red line) and 200-day (blue line) moving averages, confirming the overall bullish trend remains intact. The 50-day MA is currently providing dynamic support around the 2990 level, while the 200-day MA is trending higher around the 2950 mark, creating a strong support zone.
What’s particularly interesting is the increasing distance between these two moving averages, suggesting strengthening upward momentum. The price has been respecting the 50-day MA as support, which is a bullish sign. Any pullbacks to this moving average could present potential buying opportunities for traders looking to enter long positions.
RSI Momentum Analysis and Divergence Patterns
The Relative Strength Index (RSI-14) displayed at the bottom of the chart shows interesting developments. After reaching overbought territory earlier in March, the RSI has been normalizing while price maintains its overall structure. This suggests a healthy consolidation rather than a trend reversal.
Currently, the RSI is hovering around the midpoint of 50, indicating neutral momentum but with room to move higher. There are subtle signs of potential bullish divergence forming, as the RSI makes higher lows while price temporarily makes lower lows. If confirmed, this divergence could precede a significant upward move in gold prices.
Price Action and Candlestick Analysis
The recent candlestick patterns reveal important clues about market sentiment. We’re seeing a series of candlesticks with long lower wicks around the 2990 support level, indicating that sellers initially pushed prices lower, but buyers stepped in aggressively to push prices back up. This type of price action typically signals strong buying pressure and rejection of lower prices.
The most recent sessions show narrowing trading ranges, forming a potential bull flag or pennant pattern. This consolidation after a strong upward move often precedes continuation of the primary trend. Volume analysis (shown at the bottom of the price chart) indicates increased participation during the recent consolidation, suggesting accumulation rather than distribution.
Chart Patterns and Formation Analysis
The broader chart pattern suggests a potential bull flag formation, with the consolidation phase we’re currently witnessing representing the “flag” part of the pattern. If this pattern completes with a breakout above 3000-3010, the measured move target would be approximately 3060-3080.
Additionally, the price action is forming a series of higher lows since March 12th, creating an ascending support trendline. This structure, combined with horizontal resistance around 3010, forms an ascending triangle pattern, which is typically bullish in nature and suggests a potential breakout to the upside.
Fibonacci Retracement Levels and Extension Targets
While not directly shown on this chart, applying Fibonacci retracement to the recent rally indicates that the current consolidation is occurring around the 38.2% retracement level. This alignment with the 50-day MA reinforces the importance of the current support zone.
Looking at potential Fibonacci extension targets if gold breaks higher, the 127.2% extension level would project a move toward the 3075 area, while the 161.8% extension suggests a potential target around 3120-3130. These levels could serve as profit targets for traders taking long positions after a confirmed breakout.
🔍 MARKET OUTLOOK & TRADING SCENARIOS
Bullish Scenario for XAUUSD
In the bullish case, gold breaks decisively above the 3000-3010 resistance zone with increasing volume. This would confirm the completion of the bull flag pattern and likely accelerate momentum toward the 3050 level initially, followed by a test of the 3075-3080 zone. The RSI would likely move back above 60, confirming the renewed bullish momentum.
Key triggers for this scenario would be a daily close above 3010 with strong volume, accompanied by RSI moving above 60. Traders should watch for a potential “gap up” opening in the Asian session as a confirmatory signal for this bullish scenario.
Neutral Scenario for XAUUSD
The neutral case involves continued consolidation between 2990 support and 3010 resistance. This would represent a period of equilibrium between buyers and sellers, with price potentially forming a tighter range before the next directional move.
In this scenario, traders might consider range-trading strategies, buying near support and selling near resistance. The RSI would likely oscillate between 40 and 60, reflecting the neutral momentum. This scenario could persist for several more trading sessions before a decisive breakout occurs.
Bearish Scenario for XAUUSD
Should gold break below the critical 2990 support and the 50-day MA, we could see a deeper correction toward the 2950-2960 zone where the 200-day MA provides additional support. A close below this level would significantly weaken the bullish structure and potentially signal a shift in the medium-term trend.
Signs of this scenario unfolding would include a daily close below 2985 with increased volume, RSI breaking below 40, and a bearish crossover of short-term moving averages. However, given the overall strength of the gold market, any dips might be viewed as buying opportunities by longer-term investors.
💼 TRADING CONSIDERATIONS
When trading XAUUSD in the current market environment, consider the following strategic approaches:
- Breakout Strategy: Place buy orders above 3010 with initial targets at 3050 and extended targets at 3075-3080. Set stop-losses below the 50-day MA around 2985 to manage risk.
- Support Bounce Strategy: Look for entries near the 2990 support level on signs of price rejection (hammer or bullish engulfing candles). Target the resistance at 3000-3010 with tight stop-losses below 2980.
- Range Trading Approach: If the consolidation continues, consider buying near 2990 and selling near 3010, with appropriate stop-losses outside the range.
- Risk Management: Gold can be volatile, especially during major economic announcements. Ensure position sizing allows for normal market fluctuations without triggering premature stop-losses.
- Correlation Awareness: Monitor the US Dollar Index and Treasury yields, as both have strong inverse correlations with gold. A weakening dollar typically supports higher gold prices.
It’s worth noting that gold’s seasonal patterns often show strength during March-April, which adds a favorable backdrop to the technical setup we’re observing on the chart.
🏁 CONCLUSION
Gold (XAUUSD) is at a critical juncture, testing key technical levels that will likely determine its next directional move. The weight of evidence from our technical analysis leans bullish, with strong support at the 50-day MA and 2990 level, potential bullish RSI divergence, and constructive price patterns suggesting accumulation rather than distribution.
The most probable scenario appears to be a continuation of the primary uptrend after this period of consolidation, with a breakout above 3010 potentially triggering a move toward 3050-3080. However, traders should remain vigilant and adapt to changing market conditions, especially if support levels are violated with convincing volume and momentum.
As always with gold trading, stay aware of fundamental catalysts like central bank statements, inflation data, and geopolitical developments that can quickly alter the technical landscape.
⚠️ DISCLAIMER
This technical analysis is provided for informational and educational purposes only. Trading gold or any financial instrument involves substantial risk, and past performance is not indicative of future results. The analysis presented here represents a point-in-time assessment based on current market conditions, which can change rapidly. Always conduct your own research and consider your financial situation and risk tolerance before making trading decisions. VantoFX and its analysts are not responsible for any losses incurred based on the information provided in this analysis.


