
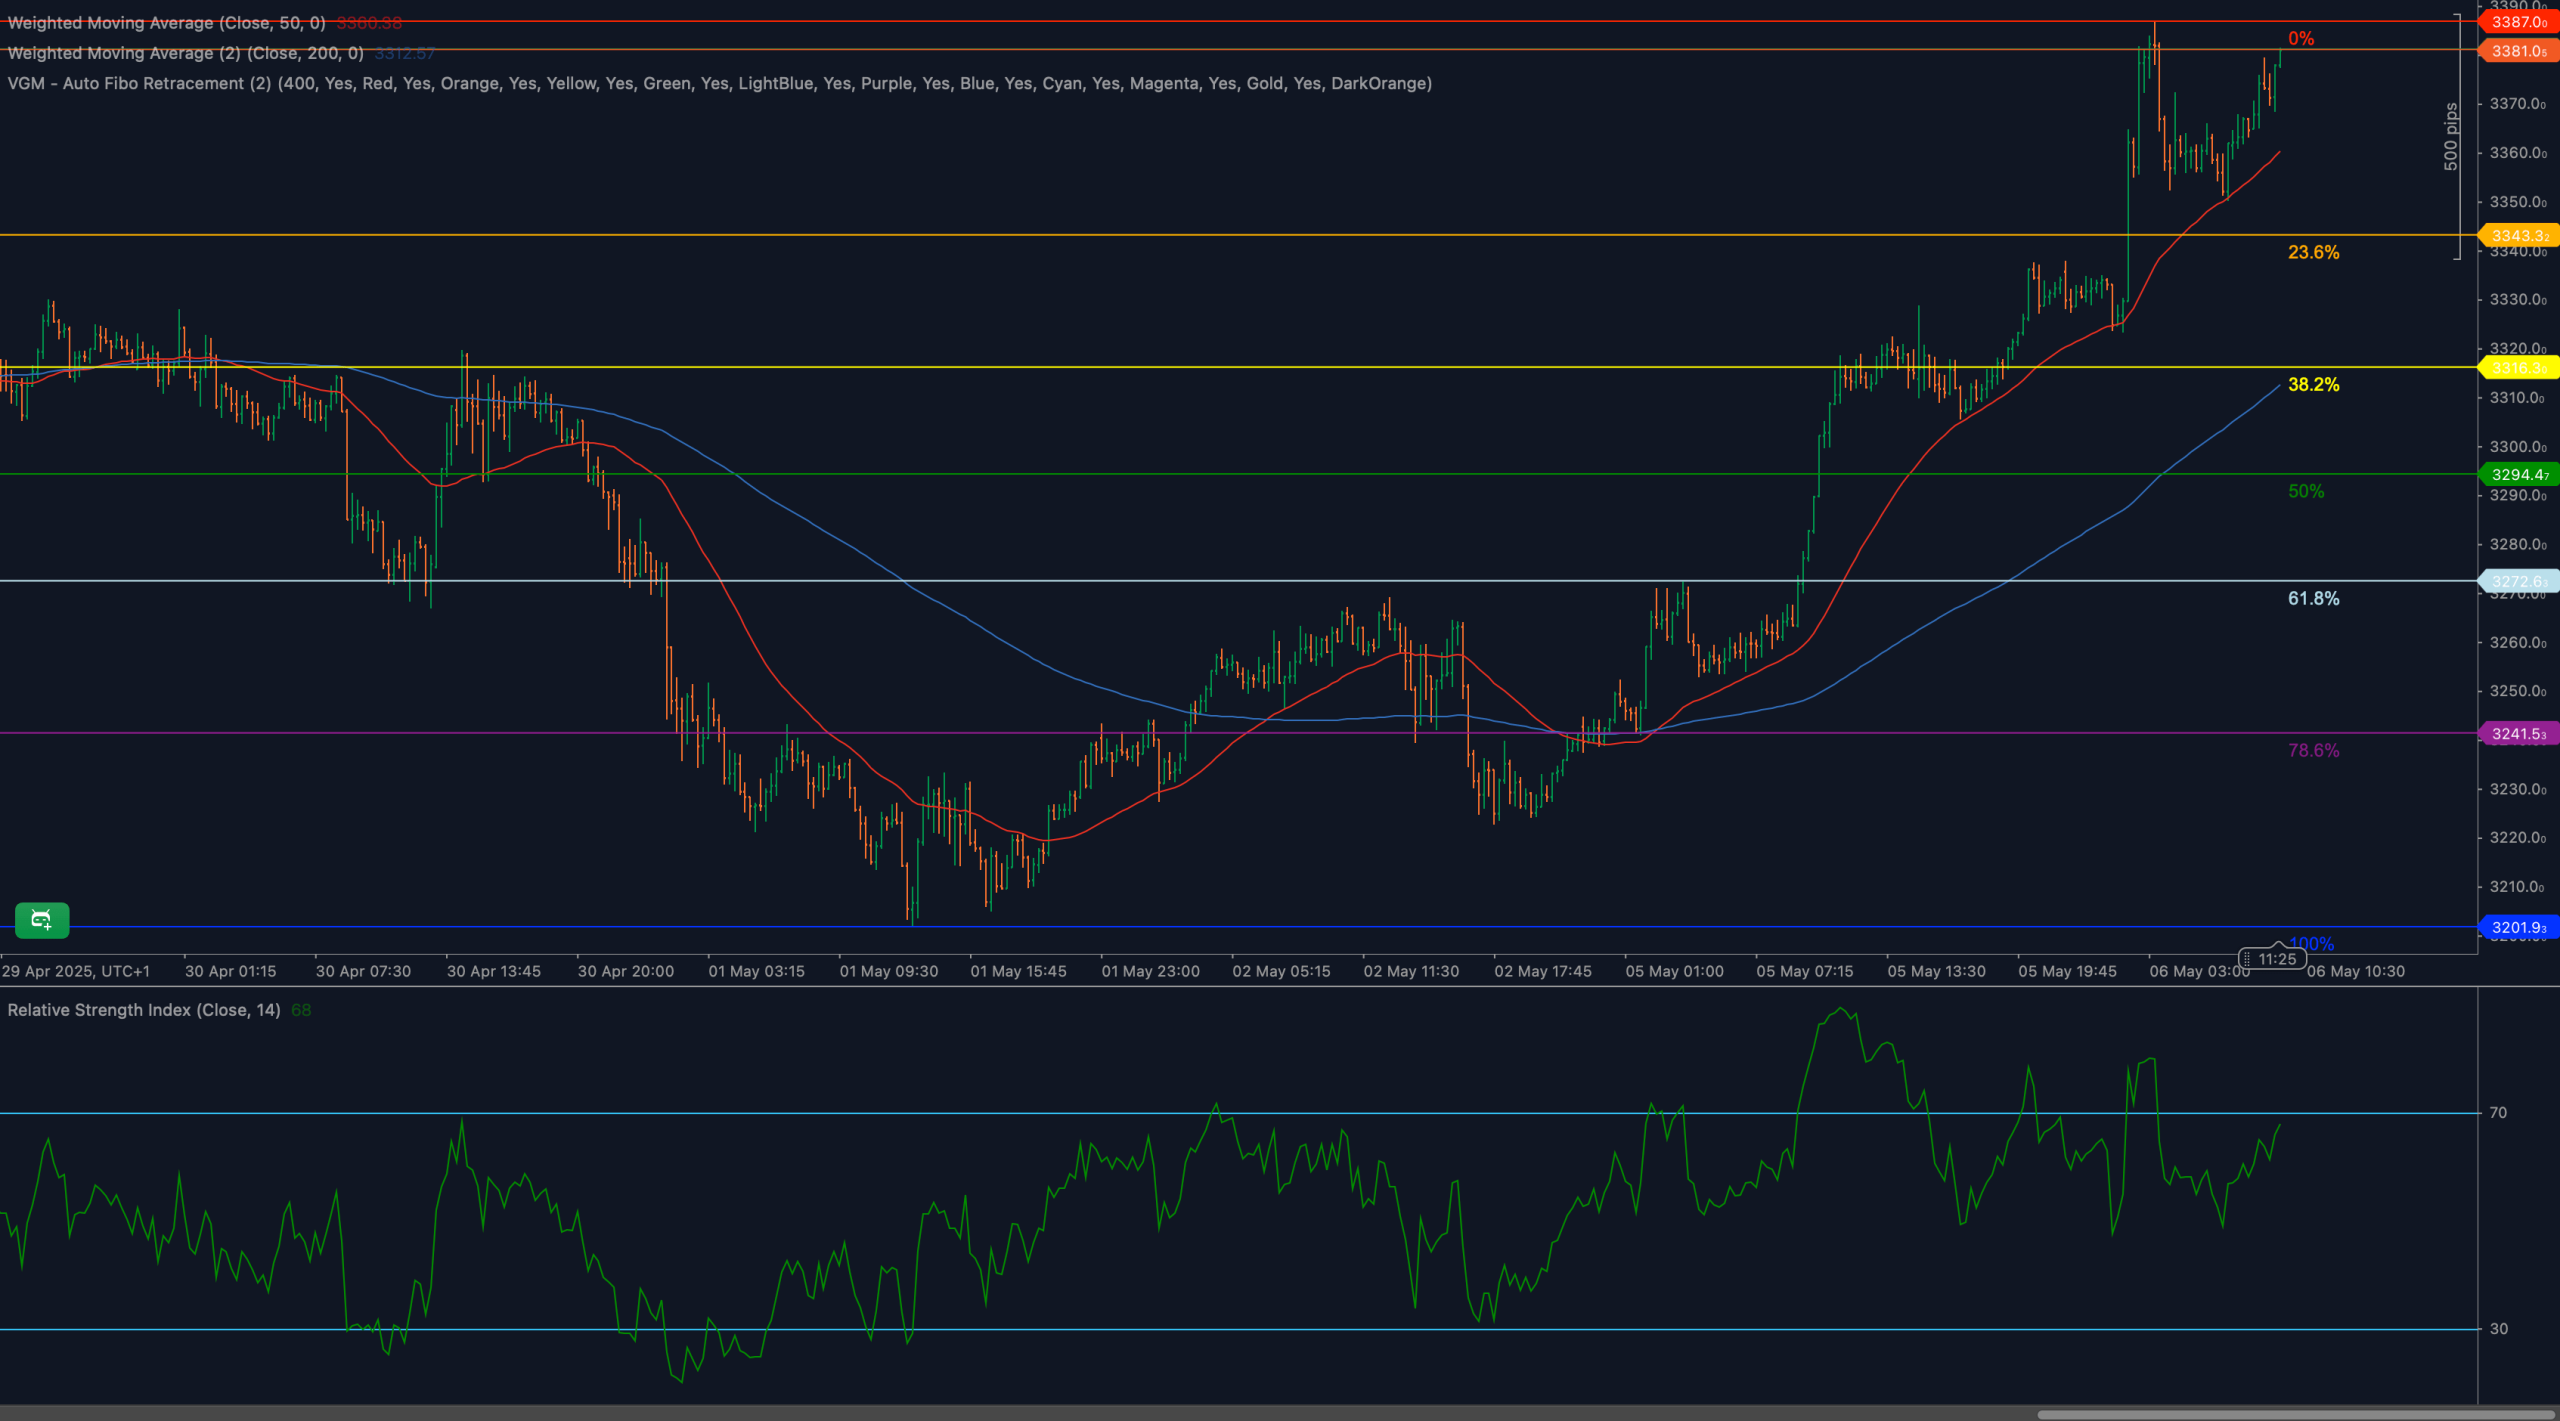
📊 MARKET OVERVIEW
Gold (XAU/USD) remains buoyant after reclaiming the 23.6% Fibonacci retracement at 3334, defined from the April 29 low at 3201.9 to the May 6 peak at 3387.0. This recovery confirms bullish commitment after a shallow correction phase. The metal is supported by retreating real yields, mixed dollar flows, and safe-haven interest amid ongoing macro uncertainty.
Momentum remains firmly in bullish territory, supported by constructive RSI behavior and an intact moving average structure. As long as price holds above 3310, the short-term technical outlook favors upside continuation toward 3387and beyond.
📈 TECHNICAL ANALYSIS
Key Support and Resistance Levels
Immediate resistance lies at 3387, which marks the upper boundary of the recent rally. A confirmed breakout above this swing high would signal a new impulsive phase. First support is now located at 3334, the prior resistance and 23.6% retracement. A deeper dip may find bids near 3310, aligned with the 38.2% Fibonacci retracement. If bearish pressure persists, the 50% level at 3294 becomes critical — a close below it would question trend integrity but not fully negate the broader structure.
Moving Averages and Dynamic Price Action
Price remains above both the 50-period and 200-period weighted moving averages (WMA). The 50-WMA is sloping upward, acting as immediate dynamic support. The 200-WMA remains flat but serves as a deeper structural floor. As long as price trades above these two lines, particularly the 50-WMA, the short-term bullish setup remains technically valid. A decisive close below it would trigger the first signal of short-term trend fatigue.
RSI Momentum and Bullish Pressure
The 14-period RSI hovers near 68, confirming sustained bullish momentum without immediate signs of overbought conditions. The indicator has maintained bullish slope and shows no negative divergence. Momentum remains healthy unless RSI drops below 50, which would indicate potential shift toward neutral or bearish control. Until then, momentum continues to favor the bulls.
Candlestick Behavior and Price Action Clarity
Recent candlesticks reflect strength, with multiple sessions closing near highs and lacking significant upper wicks. The breakout above 3334 was confirmed with strong-bodied bullish candles. There are no reversal formations such as bearish engulfing or shooting stars. Price action suggests control remains with buyers, and until candles begin printing long upper shadows or indecisive closes, directional momentum remains intact.
Chart Structure and Breakout Formation
The chart shows a clean rounded base breakout, with higher lows forming beneath a horizontal neckline at 3334. Price has reclaimed that neckline and advanced toward 3387, the former high. This structure remains constructive for continuation, and unless 3310 or 3294 are broken on a closing basis, buyers remain in command. A confirmed breakout above 3387 would signal the start of a new extension leg, potentially targeting Fibonacci projection zones.
Fibonacci Retracement and Extension Levels
The retracement framework based on the 3201.9 to 3387.0 leg remains active. The 23.6% retracement at 3334 is a key pivot already reclaimed by bulls. The 38.2% retracement at 3310 stands as the next buffer in case of pullbacks, while the 50% level at 3294 is considered critical for preserving the bullish bias. A deeper move to the 61.8% retracement at 3277 would indicate a weakening structure. If price tests the 78.6% retracement at 3241.5, trend exhaustion becomes likely. A full retracement to 3201.9 would confirm failure of the bullish impulse. Should 3387 be broken, Fibonacci extensions such as 1.272 and 1.618 become active with upward targets above the May peak.
🔍 MARKET OUTLOOK & TRADING SCENARIOS
Bullish Scenario
A sustained push above 3387 supported by RSI strength would validate trend continuation. Price would then enter an extension phase, with buyers targeting levels beyond the current range. Structure remains bullish as long as the market defends 3334 and 3310.
Neutral Scenario
Range-bound price action between 3310 and 3387 would indicate temporary consolidation. RSI remaining between 55–65 would support this thesis. Traders would monitor for breakout confirmation in either direction before reassessing bias.
Bearish Scenario
A breakdown through 3310 followed by a close below 3294 would invalidate short-term structure and raise risks of a broader correction. If RSI drops below 50 and the 50-WMA flattens, bearish pressure could extend toward 3277 or 3241.5, forcing a reassessment of medium-term direction.
💼 TRADING CONSIDERATIONS
Bullish setups favor long entries near 3334 or 3310, with stops beneath 3294 and targets near 3387 or Fibonacci expansions. Bearish setups require structural breakdowns and RSI confirmation, targeting 3277 and below. Traders should expect increased volatility around the 3387 breakout zone and structure entries accordingly.
🏁 CONCLUSION
XAU/USD maintains a bullish posture, having reclaimed the 3334 level and pressing toward the 3387 high. Momentum is supported by RSI, moving averages, and clean price action. As long as 3310 and 3294 remain intact, the broader trend favors continuation. A confirmed breakout above 3387 would open the path to higher Fibonacci extensions. Bears require a multi-tier breakdown to shift the bias.
⚠️ DISCLAIMER
This analysis is for informational purposes only and does not constitute financial advice. Always consult with a licensed financial professional before making trading decisions.


