
📊 MARKET OVERVIEW
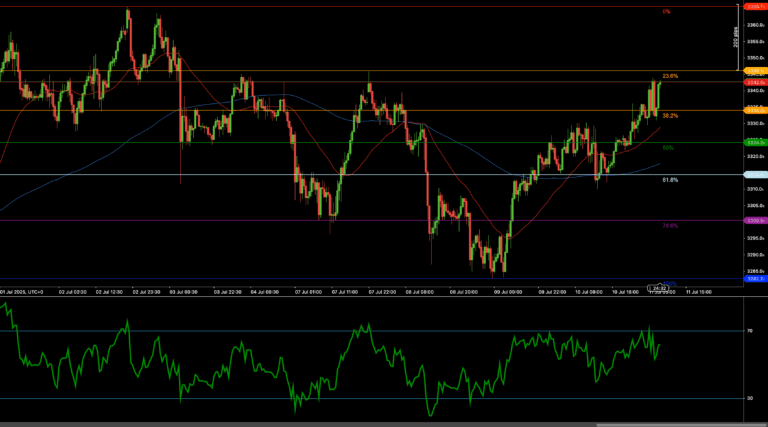
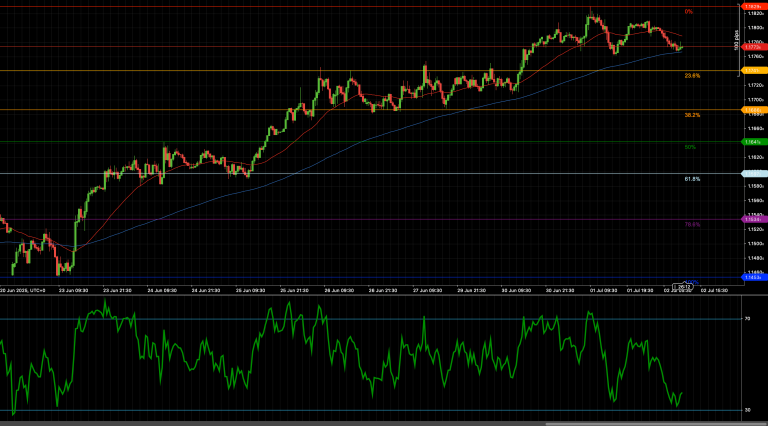
Gold (XAU/USD) continues its rebound from the recent swing low near 3,285, with the price pushing toward the 3,344 resistance, corresponding to the 23.6% Fibonacci retracement of the June–July downtrend. The recovery has been supported by improved risk sentiment, weakening US yields, and a firmer demand for safe havens. Moving averages are turning neutral-to-positive, while RSI momentum confirms the bullish bounce. For bulls, a breakout above 3,344 would signal the continuation of the recovery toward higher resistance zones, while sellers will watch for rejection and a return toward key support at 3,330 and 3,322.
📈 TECHNICAL ANALYSIS
Key Support and Resistance Levels
The nearest resistance sits at 3,344, the 23.6% Fibonacci retracement. A confirmed breakout would expose upside targets at 3,365, near the 0% Fibonacci level, and then the psychological 3,375 zone. On the downside, key support lies at 3,330, followed by 3,322, the 38.2% retracement. A break below these levels would shift the focus to the 50% retracement at 3,311 and the 61.8% zone at 3,299.
Moving Averages and Dynamic Price Action
XAU/USD has reclaimed its 50-period weighted moving average, with the 200-WMA flattening around 3,311. The rising 50-WMA supports near-term bullish momentum, while the broader structure turns positive as long as the price holds above the 200-WMA. The moving averages now offer dynamic support zones that traders will watch closely on any pullbacks.
RSI Momentum and Trend Strength
The 14-period RSI has improved and stabilizes near the 60 level, showing that bullish momentum is active but not yet overextended. A sustained move above 65 on the RSI would signal strong upside continuation. A decline below 50 would indicate weakening momentum and raise the probability of a retest of lower support zones.
Candlestick Structure and Market Tone
Recent candlesticks show consistent upward closes and higher lows, reflecting healthy bullish sentiment. However, the cluster of small-bodied candles near 3,344 signals indecision at this resistance zone. A clear bullish engulfing candle above 3,344 would confirm a breakout, while repeated rejection candles may trigger a short-term pullback.
Chart Structure and Trend Integrity
The broader XAU/USD structure has shifted from bearish to neutral-bullish, following the formation of a higher low near 3,285. The rebound toward 3,344 fits a classic retracement scenario after a downtrend, and a break above 3,344 would likely restore the medium-term uptrend bias. A drop below 3,311, however, would call the recovery into question.
Fibonacci Roadmap and Target Zones
The Fibonacci retracement of the June–July decline places key levels as follows: resistance at 3,344 (23.6%), then 3,365 (swing high). Support sits at 3,330 (short-term floor), followed by 3,322 (38.2%), then 3,311 (50%), and finally 3,299 (61.8%). Price action around 3,344 will define whether bulls can extend this recovery phase.
🔍 MARKET OUTLOOK & TRADING SCENARIOS
Bullish Scenario
A sustained close above 3,344, coupled with RSI pushing above 65, would confirm breakout continuation. Bulls would then aim for 3,365, with scope for an extension toward 3,375.
Neutral Scenario
Sideways movement between 3,322 and 3,344 would keep XAU/USD in consolidation mode. RSI would likely remain between 50 and 65. Traders may use range-trading strategies until a clear breakout or breakdown occurs.
Bearish Scenario
A failure to hold above 3,330, particularly with RSI dropping below 50, would suggest downside risk toward 3,311 and 3,299. This would shift the near-term bias to neutral-bearish.
💼 TRADING CONSIDERATIONS
• Bullish setup: Buy breakout above 3,344, targeting 3,365 and 3,375. Stop loss below 3,330.
• Bearish setup: Sell breakdown below 3,330, targeting 3,322 and 3,311. Stop above 3,344.
• Range play: Fade the 3,322–3,344 band with tight stops and RSI confirmation.
🏁 CONCLUSION
XAU/USD is attempting to extend its recovery but faces stiff resistance at 3,344. Bulls will need to break above this zone to open the next leg toward 3,365 and beyond. Failure to clear 3,344 or a break below 3,330 could return the pair to consolidation or corrective territory. RSI and candlestick patterns will provide further confirmation in the coming sessions.
⚠️ DISCLAIMER
This analysis is for informational purposes only and does not constitute financial advice. Always consult a licensed financial advisor before making investment decisions.