
📊 MARKET OVERVIEW
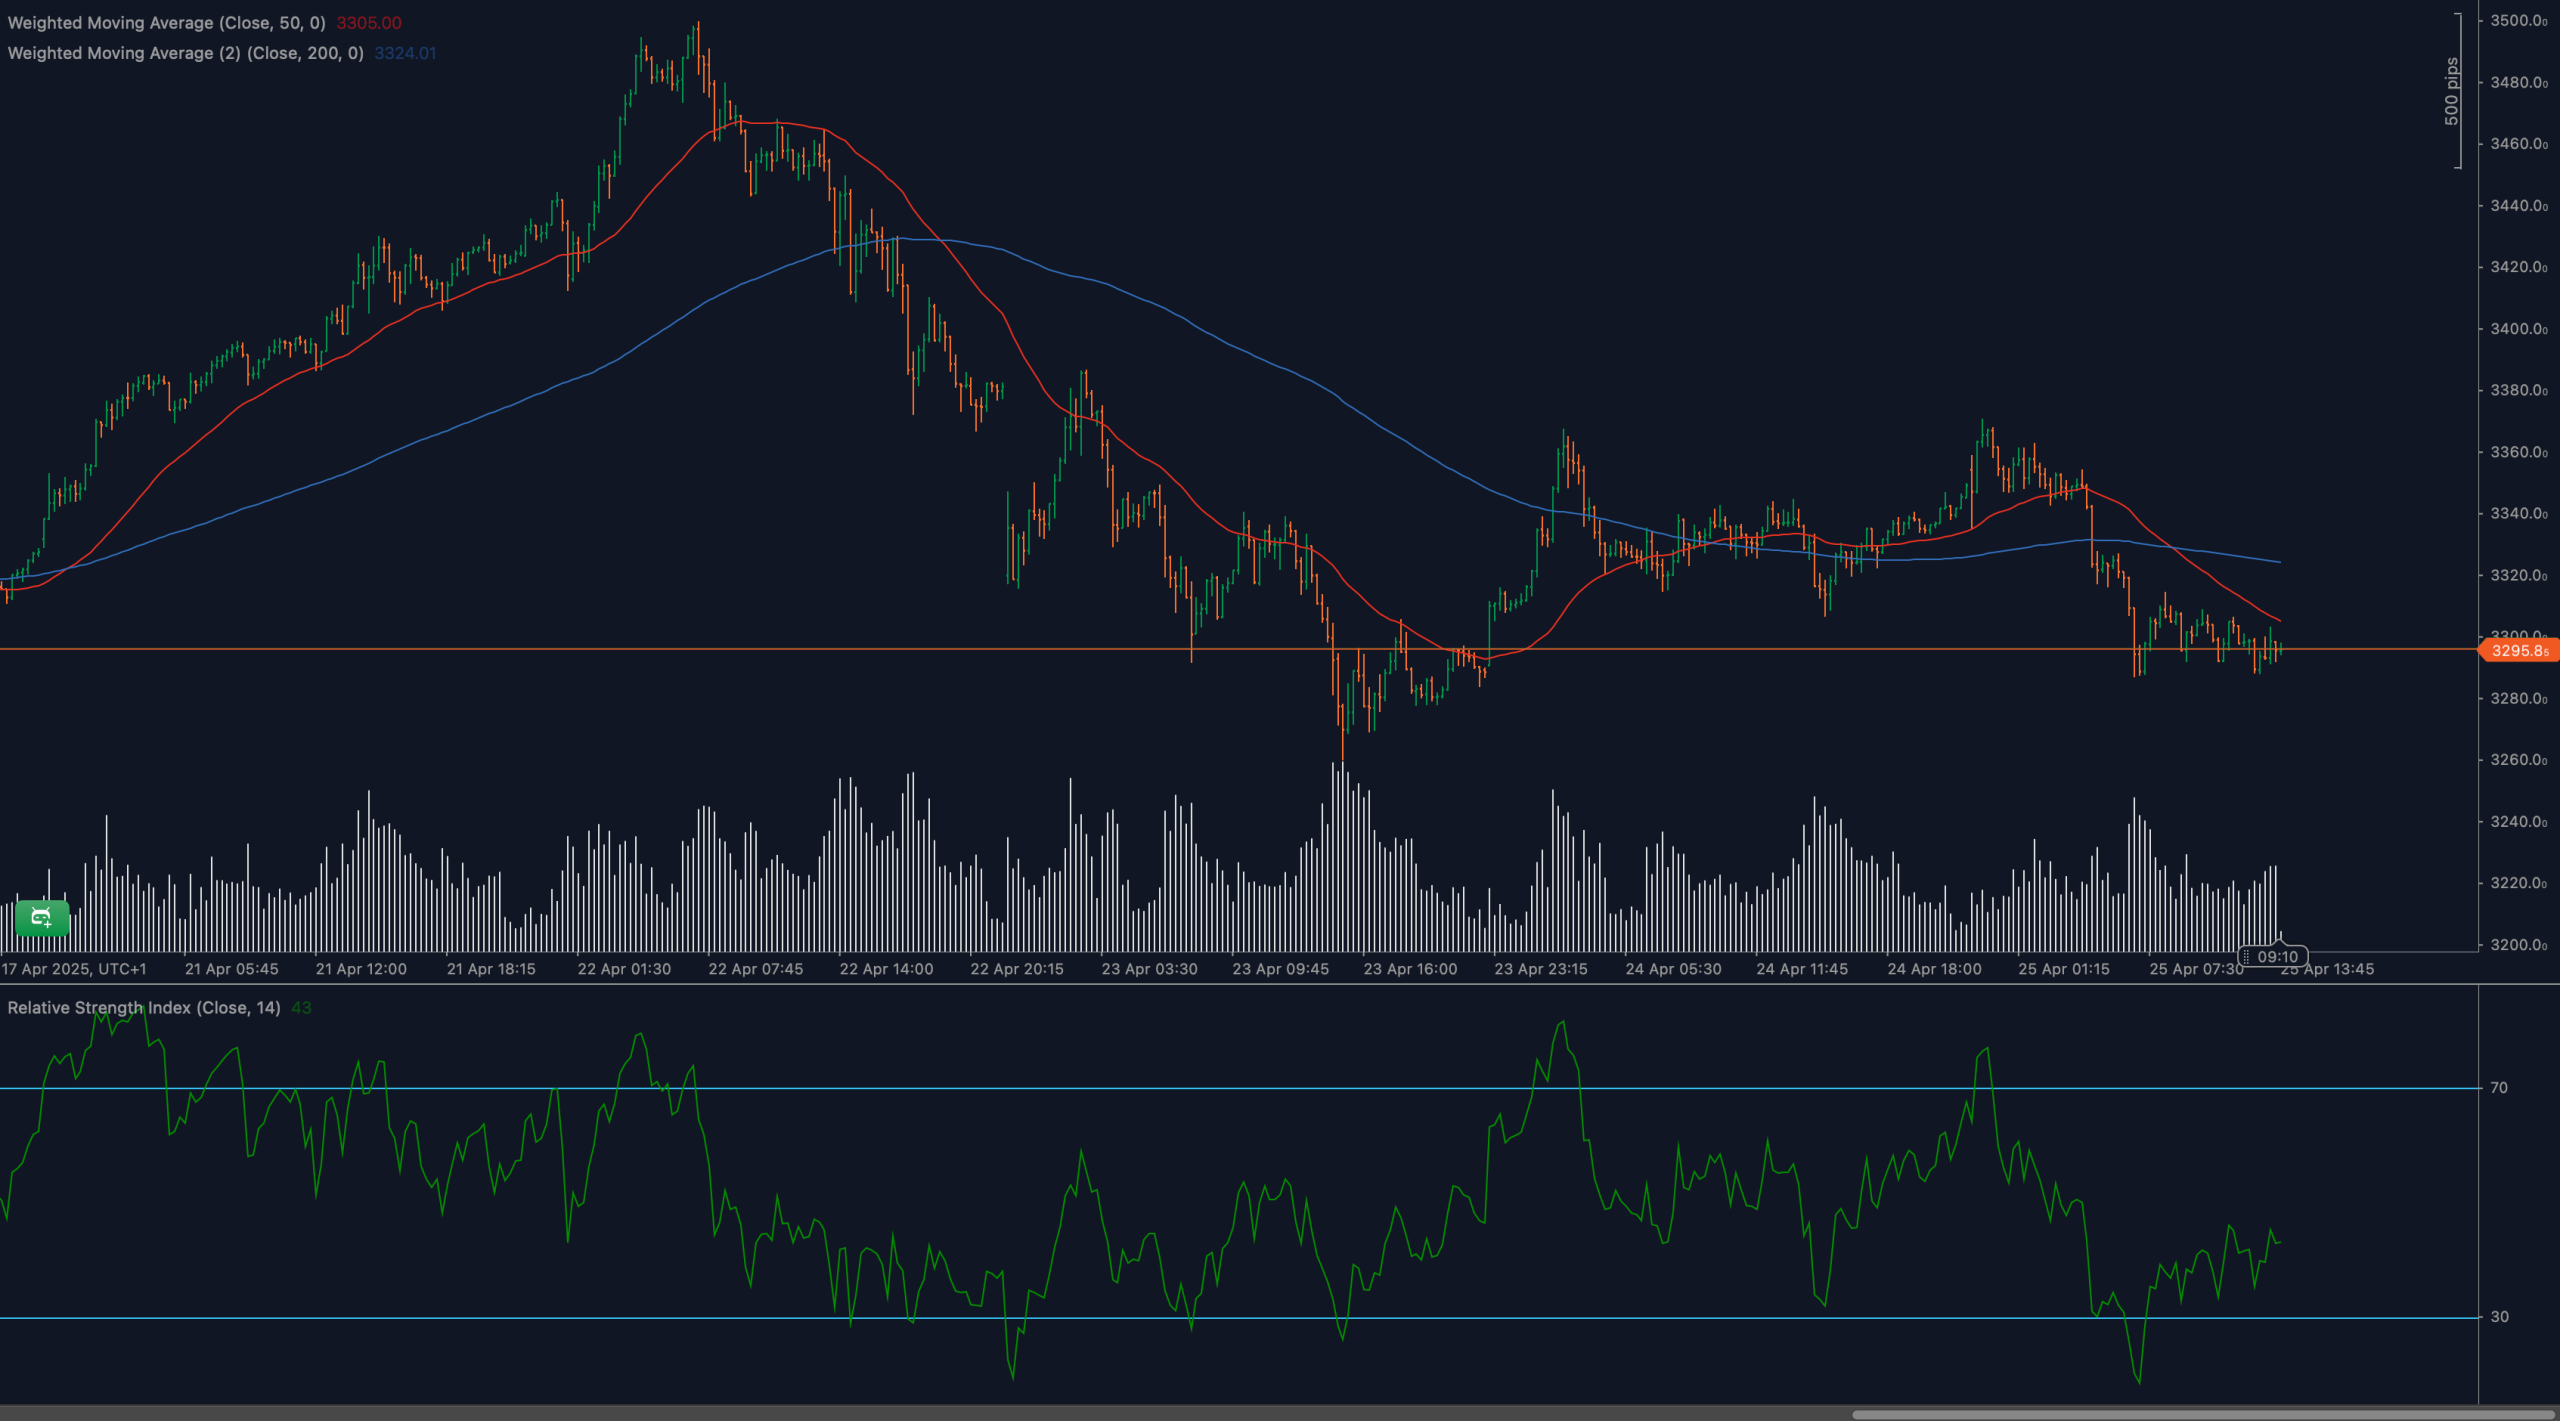
Gold (XAU/USD) is struggling after a sharp pullback brought it back toward the 3295 support level — a zone that previously marked a consolidation base before the last rally. After peaking above 3460 earlier in April, gold has consistently posted lower highs and now finds itself below both the 50- and 200-period moving averages.
This move reflects a decisive shift in short-term momentum. Volume increased during the selloff, and RSI remains stuck below neutral. While price is stabilizing near support, there are no strong reversal signals yet. If buyers can defend 3295, a bounce is possible — but a breakdown would likely accelerate the current bearish trend.
📈 TECHNICAL ANALYSIS
What Are the Key Support and Resistance Levels for XAU/USD?
Immediate support is found at 3295, followed by 3275 and 3250 as deeper technical levels. Resistance is now overhead at 3320, the breakdown point, and then 3350, which aligns with the declining 50-WMA. A return above 3350 would begin to shift the short-term structure back in favor of bulls.
Moving Average Analysis and Dynamic Price Levels
Gold is trading below both the 50-period WMA (3305.00) and the 200-period WMA (3324.01). The 50-WMA has crossed below the 200-WMA, a classic bearish crossover. This dynamic reinforces the downward pressure and suggests any rebounds may be capped by these levels unless a sharp breakout occurs.
RSI Momentum Analysis and Divergence Patterns
The 14-period RSI currently reads 43, having rebounded slightly from oversold territory earlier this week. The fact that RSI has not reclaimed the 50 midpoint highlights persistent weakness in buying pressure. There is no visible bullish divergence yet, so any long setups will need confirmation from price action first.
Price Action and Candlestick Analysis
Candlestick structure shows a deceleration of the selloff near 3295, with smaller-bodied candles and slight upticks in volume — signs of potential stabilization. However, no clear bullish reversal pattern has emerged. A strong bullish engulfing or morning star setup would be required to confirm a base here.
Chart Patterns and Formation Analysis
The broader structure resembles a descending triangle, with horizontal support near 3295 and a series of lower highs. If price breaks below the support base, the pattern projects a continuation move toward 3250 or even 3220. Alternatively, a bounce above 3320 could break the sequence of lower highs and open the door for reaccumulation.
Fibonacci Retracement Levels and Extension Targets
Using the swing from 3460 to 3275, the 23.6% Fibonacci retracement lies at 3320, which overlaps with key resistance. The 38.2% level is at 3355, near the 50-WMA. To the downside, a break of 3295 exposes 3250, then 3220, aligned with extension targets from the recent breakdown.
🔍 MARKET OUTLOOK & TRADING SCENARIOS
Bullish Scenario for XAU/USD
If price holds 3295 and reclaims 3320, especially with RSI above 50 and bullish candles forming, a short-term recovery may be underway. This setup targets 3350, and possibly 3380 on strong continuation. Bullish setups should wait for clear breakout patterns above the moving averages.
Neutral Scenario for XAU/USD
If gold trades sideways between 3295 and 3320, expect consolidation. RSI hovering between 45–50 and small-bodied candles would support a wait-and-see bias. This scenario benefits range traders and those awaiting directional confirmation.
Bearish Scenario for XAU/USD
A break and close below 3295, especially with increasing volume and RSI below 40, would confirm bearish continuation. This setup targets 3275, 3250, and eventually 3220. Watch for failed retests of 3320 as potential entry signals for bears.
💼 TRADING CONSIDERATIONS
Bullish traders should wait for a bounce confirmation off 3295, paired with reversal candlestick signals and RSI recovery above 50. Long targets lie at 3320 and 3350, with stops below 3280.
Bearish setups are favored below 3295, with confirmation from price rejection at 3320 or lower-high formations. Ideal targets include 3250 and 3220, while stops should remain above the 50-WMA for protection.
🏁 CONCLUSION
XAU/USD is testing a critical support zone at 3295 following a swift and deep selloff. Momentum remains bearish, but early signs of stabilization are appearing. A confirmed breakout or breakdown will define the next wave, and traders should align with whichever side shows momentum and volume confirmation.
⚠️ DISCLAIMER
This report is for educational purposes only and does not constitute financial advice. All trading involves risk. Please consult a licensed financial advisor before making investment decisions.


