📊 Market Overview
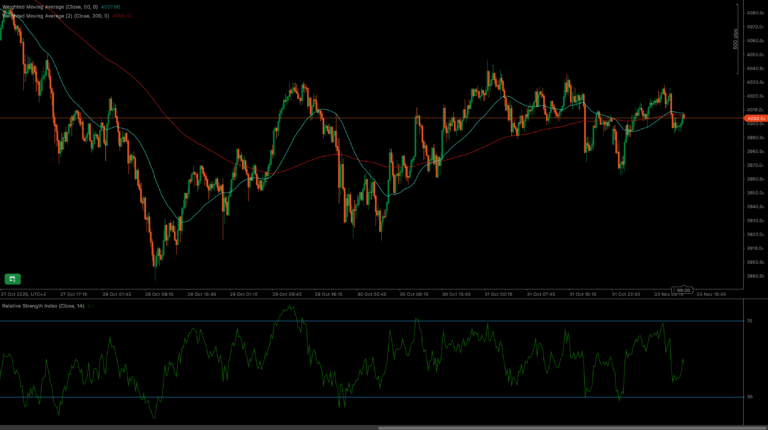
The XAUUSD has been trading in a sideways channel recently, oscillating between support and resistance levels defined by the 50 and 200 period WMAs. A breakout from this consolidation pattern is needed to establish a clear directional bias.
After a period of volatility, the XAUUSD found stability, trading within a defined range. Market sentiment appears indecisive, with both buyers and sellers struggling to gain a decisive advantage.
📈 Technical Analysis
Key Support and Resistance Levels
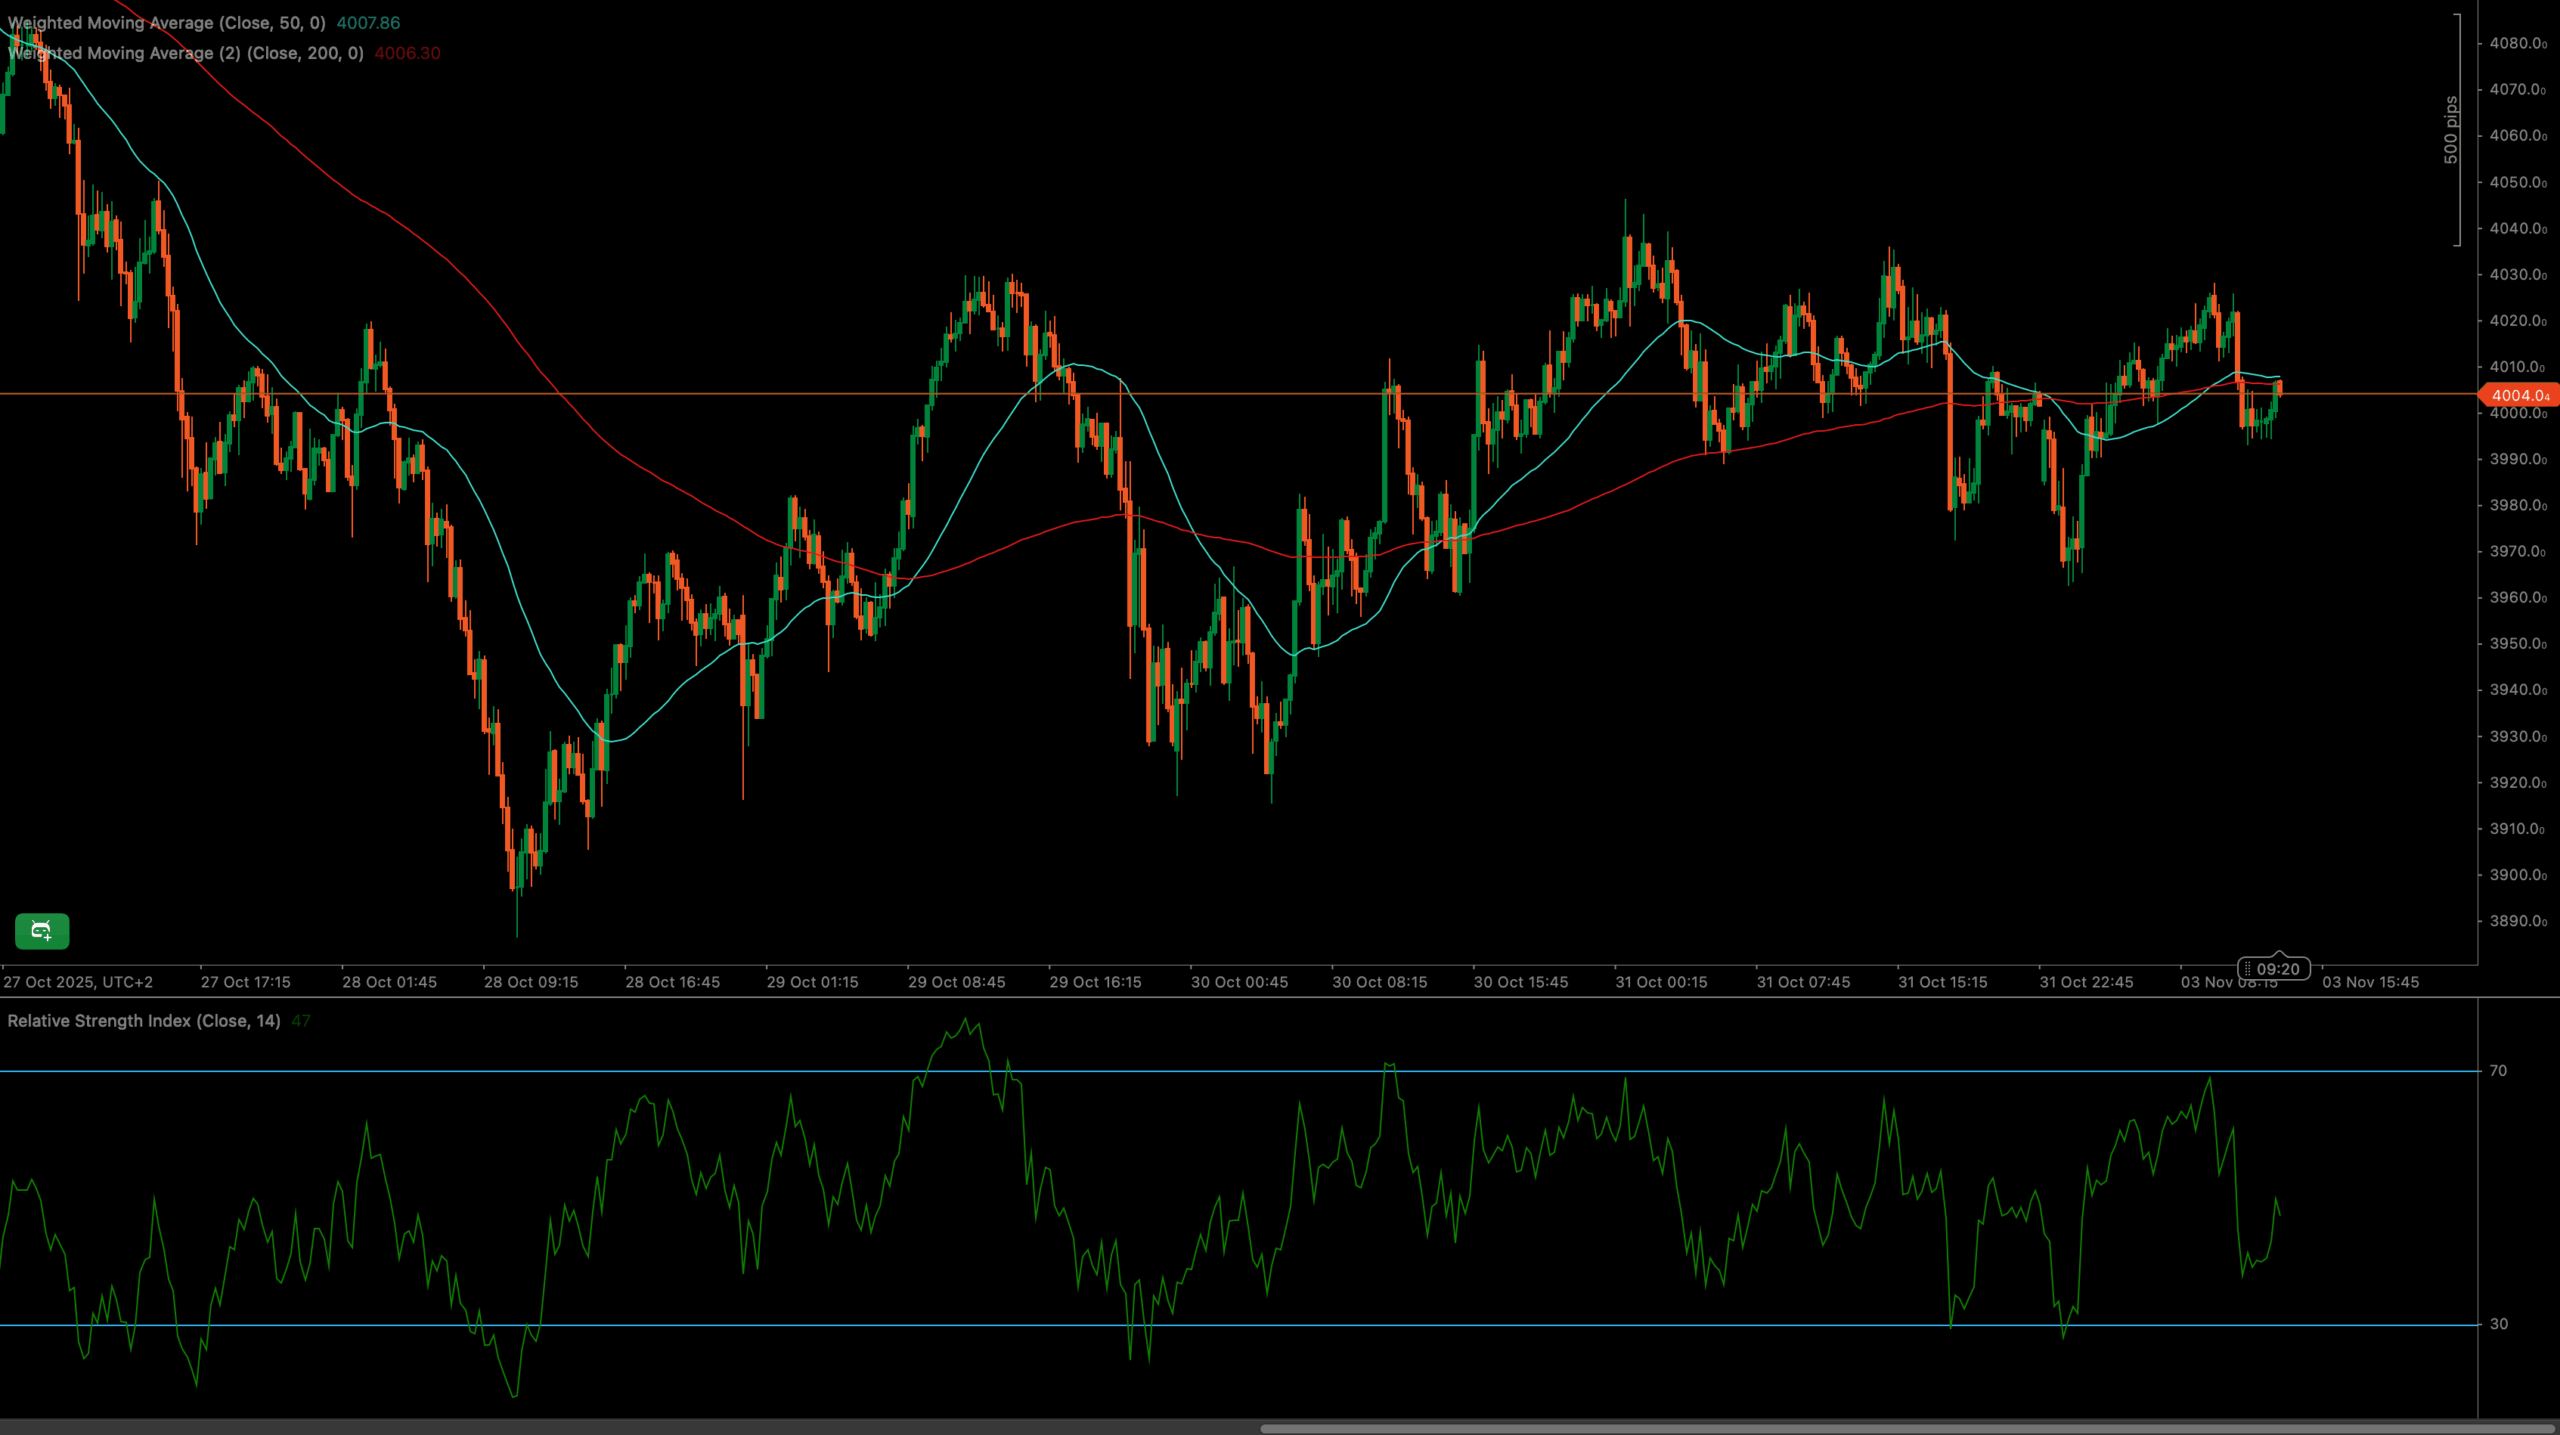
Immediate resistance for the XAUUSD is near 4030, while a key support level is established where the price is currently, right above the intersection of the 50-period Weighted Moving Average (WMA) (cyan) and the 200-period WMA (red). A clear break above 4030 would signal bullish continuation, while a drop below the moving averages could lead to a test of lower levels.
Moving Average Analysis for XAUUSD
The XAUUSD appears to be trading in a neutral trend as it is currently navigating around both the 50 WMA (cyan line) and the 200 WMA (red line) which are intertwined, suggesting indecision in the market. The intersection of both averages highlights the tug of war between bullish and bearish forces. A definitive move above or below these moving averages will dictate the next directional move.
RSI and Momentum Shift in XAUUSD
The Relative Strength Index (RSI) currently sits around 47, indicating neutral momentum for the XAUUSD. It is neither in overbought nor oversold territory, suggesting there is room for movement in either direction based on upcoming price action. The RSI has been oscillating within a moderate range, aligning with the sideways movement observed in the price chart.
Volume Spike and Market Participation
Without visible volume data, it’s difficult to accurately assess market participation. However, traders should monitor volume on their platforms. A spike in buying volume on a breakout above resistance would validate the bullish scenario. Conversely, increased selling volume on a breakdown below support would reinforce the bearish outlook for the XAUUSD.
Candlestick Tone and Market Reaction for XAUUSD
Recent candlestick patterns for the XAUUSD show mixed signals, reflecting the ongoing consolidation. The presence of indecisive candles, such as dojis or spinning tops, near the moving averages, suggests uncertainty. Traders should watch for strong bullish or bearish candlestick patterns that confirm a breakout or breakdown from the current trading range.
🔍 Market Outlook & Trading Scenarios
Bullish Scenario
If the XAUUSD breaks decisively above 4030, with the 50 WMA crossing above the 200 WMA, we could see a push towards higher resistance levels. Increased buying volume and a rising RSI would support this upward move.
Neutral Scenario
The XAUUSD may continue its consolidation between the 50 and 200 WMAs, with the RSI remaining around 47. Sideways trading will persist until a significant catalyst triggers a breakout or breakdown.
Bearish Scenario
A break below the intertwined 50 and 200 WMAs, accompanied by increasing bearish momentum and a drop in RSI, could lead the XAUUSD to test lower support levels. Confirmation from strong bearish candlesticks would further validate this bearish outlook.
💼 Trading Considerations
- Bullish setup: Look for a confirmed breakout above 4030, supported by increasing volume. Enter long positions with a target at the next resistance level.
- Breakout setup: A definitive move above 4030 or below the 50/200 WMAs intersection could signal a potential directional move. Traders should prepare to enter positions accordingly, with appropriate stop-loss orders.
- Bearish setup: A confirmed breakdown below the 50/200 WMAs, coupled with a declining RSI, could offer short opportunities targeting lower support levels.
🏁 Conclusion
The XAUUSD is at a pivotal point, trading near the intersection of key moving averages. The index’s ability to break out or break down from this consolidation pattern will determine its short-term trajectory. The neutral RSI suggests that traders should remain patient and await confirmation before committing to a directional bias.
Traders should monitor these key technical levels closely. A decisive move above resistance or below support could provide profitable trading opportunities for the XAUUSD.
⚠️ Disclaimer
This analysis is for informational purposes only and does not constitute financial advice. Always consult a licensed financial advisor before making trading decisions.