
📊 MARKET OVERVIEW
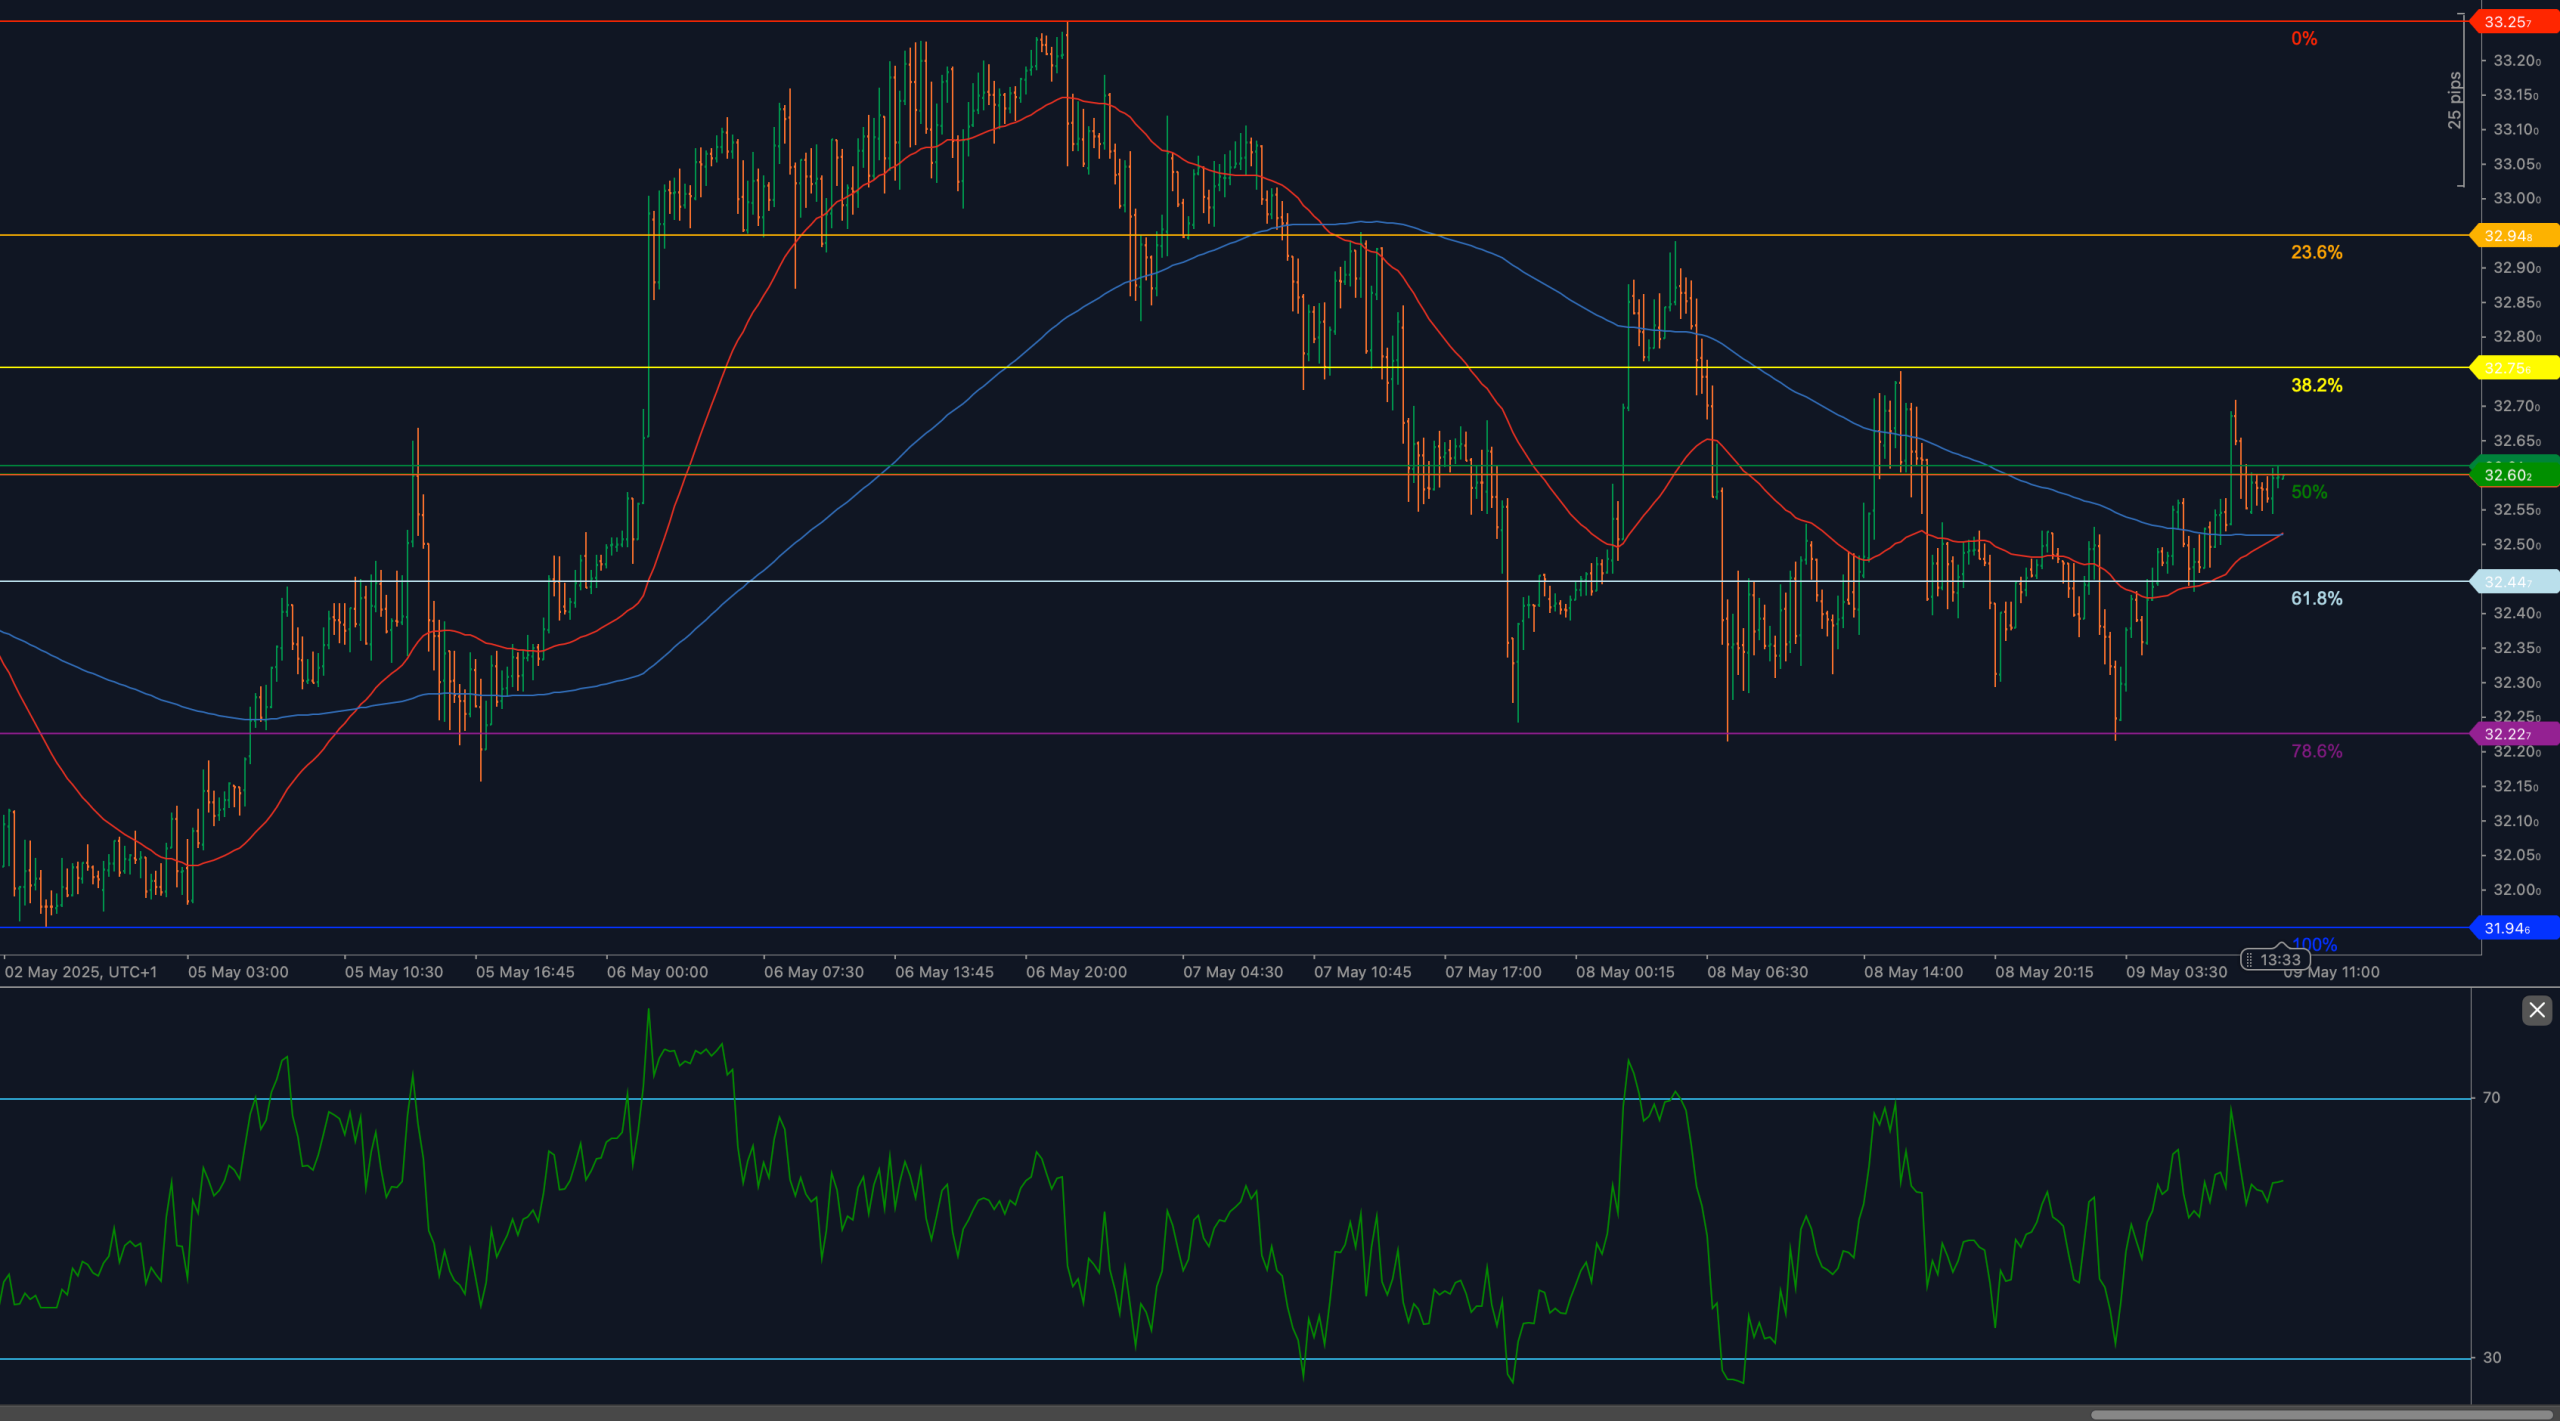
Silver (XAG/USD) is attempting to recover after an extended correction from the May high at 33.25. Price action has reclaimed the 50% Fibonacci retracement at 32.60, drawn from the May 2 low at 31.94 to the May 6 high. However, momentum is stalling just beneath the 38.2% retracement at 32.70, which marks the first significant resistance barrier within the current recovery structure.
This move comes amid broad commodity stabilization, with metals attempting to rebuild structure following recent volatility. For silver, price must now prove commitment above 32.70 to avoid rejection and return to the lower range.
📈 TECHNICAL ANALYSIS
Key Support and Resistance Levels
The immediate resistance is located at 32.70, corresponding with the 38.2% Fibonacci retracement and reinforced by local price congestion. A confirmed breakout above this level would open the path to 32.94 and ultimately 33.25, the May high. Support is now defined by the 50% retracement at 32.60, and deeper retracement zones lie at 32.40 (61.8%) and 32.22 (78.6%). These levels are essential for maintaining the recovery profile if rejection occurs.
Moving Averages and Dynamic Price Action
Price has moved back above both the 50-period and 200-period weighted moving averages, with the 50-WMA now beginning to curl upward. This is the first constructive dynamic shift since the breakdown earlier this week. However, both moving averages still converge tightly near 32.50–32.60, creating a cluster zone where directional commitment must emerge. Holding above this band favors continuation, while a drop back below would reinforce neutrality.
RSI Momentum and Bullish Pressure
The 14-period RSI has recovered to the 60 zone, reflecting early-stage bullish momentum without breaching overbought territory. RSI has made a clean upward cross from oversold conditions and remains supportive of further recovery, provided price action confirms. A break above 65 would strengthen the bullish case, while a slide back under 50 would reintroduce bearish bias.
Candlestick Behavior and Price Action Clarity
Candles have shifted from indecisive to directional, with recent sessions printing higher lows and firm closes above the 50% zone. However, price has not yet overcome the 32.70–32.75 congestion block, and recent upper wicks show hesitation. A decisive candle close above 32.70 with follow-through would mark bullish confirmation. Until that occurs, the rally remains vulnerable to a pullback.
Chart Structure and Breakout Formation
The broader structure resembles a retracement channel following a sharp prior rally. After testing the 61.8% retracement at 32.40, price rebounded in a controlled fashion, reclaiming mid-range Fibonacci levels. Current structure shows potential for bullish reversal, but confirmation is pending. The pattern may evolve into an inverted head-and-shoulders if 32.70 breaks. A failure at current levels would shift the structure back into consolidation.
Fibonacci Retracement and Extension Levels
The Fibonacci grid drawn from the 31.94 low to 33.25 high creates the current structure of interest. The 50% retracement at 32.60 is acting as a pivot, while 38.2% at 32.70 now caps momentum. If that level is broken, silver may test 32.94 and then extend to full recovery at 33.25. On the downside, a break below 32.60 exposes 32.40 (61.8%), 32.22 (78.6%), and 31.94 (100%) — each functioning as downside targets and sentiment gauges. The battle now centers around the 32.60–32.70 range.
🔍 MARKET OUTLOOK & TRADING SCENARIOS
Bullish Scenario
If price confirms a breakout above 32.70 and RSI pushes above 65, silver could resume its previous trend toward 33.25. Reclaiming that level would validate a continuation pattern and open the path to fresh yearly highs.
Neutral Scenario
Price holds between 32.40 and 32.70, forming a narrow consolidation range as RSI stays between 50–60. A coil structure could emerge, with breakout direction dictating the next major leg.
Bearish Scenario
Failure to hold 32.60, particularly on strong bearish candles, would return pressure toward 32.40, then 32.22 and 31.94. RSI dipping below 50 would confirm return of bearish momentum.
💼 TRADING CONSIDERATIONS
Bulls may look for continuation signals above 32.70 with stops beneath 32.40. Bears would require confirmation of rejection candles at resistance, with target zones staged near lower retracements. Volatility expected near 32.60–32.70 decision range.
🏁 CONCLUSION
XAG/USD has reclaimed the 50% retracement at 32.60 but remains capped under the 38.2% Fibonacci at 32.70, with both moving averages clustering in a pivotal zone. RSI has recovered but needs further confirmation. A breakout above 32.70 would confirm bullish momentum, while rejection here could re-expose the lower Fibonacci structure.
⚠️ DISCLAIMER
This analysis is for informational purposes only and does not constitute financial advice. Always consult with a licensed financial professional before making trading decisions.


