
Gold (XAU/USD) is currently trading near a critical resistance level of 2761, reflecting a recovery attempt following recent bearish momentum. Market participants are now closely monitoring whether the metal can sustain this momentum or face rejection at the current level.
Technical Analysis
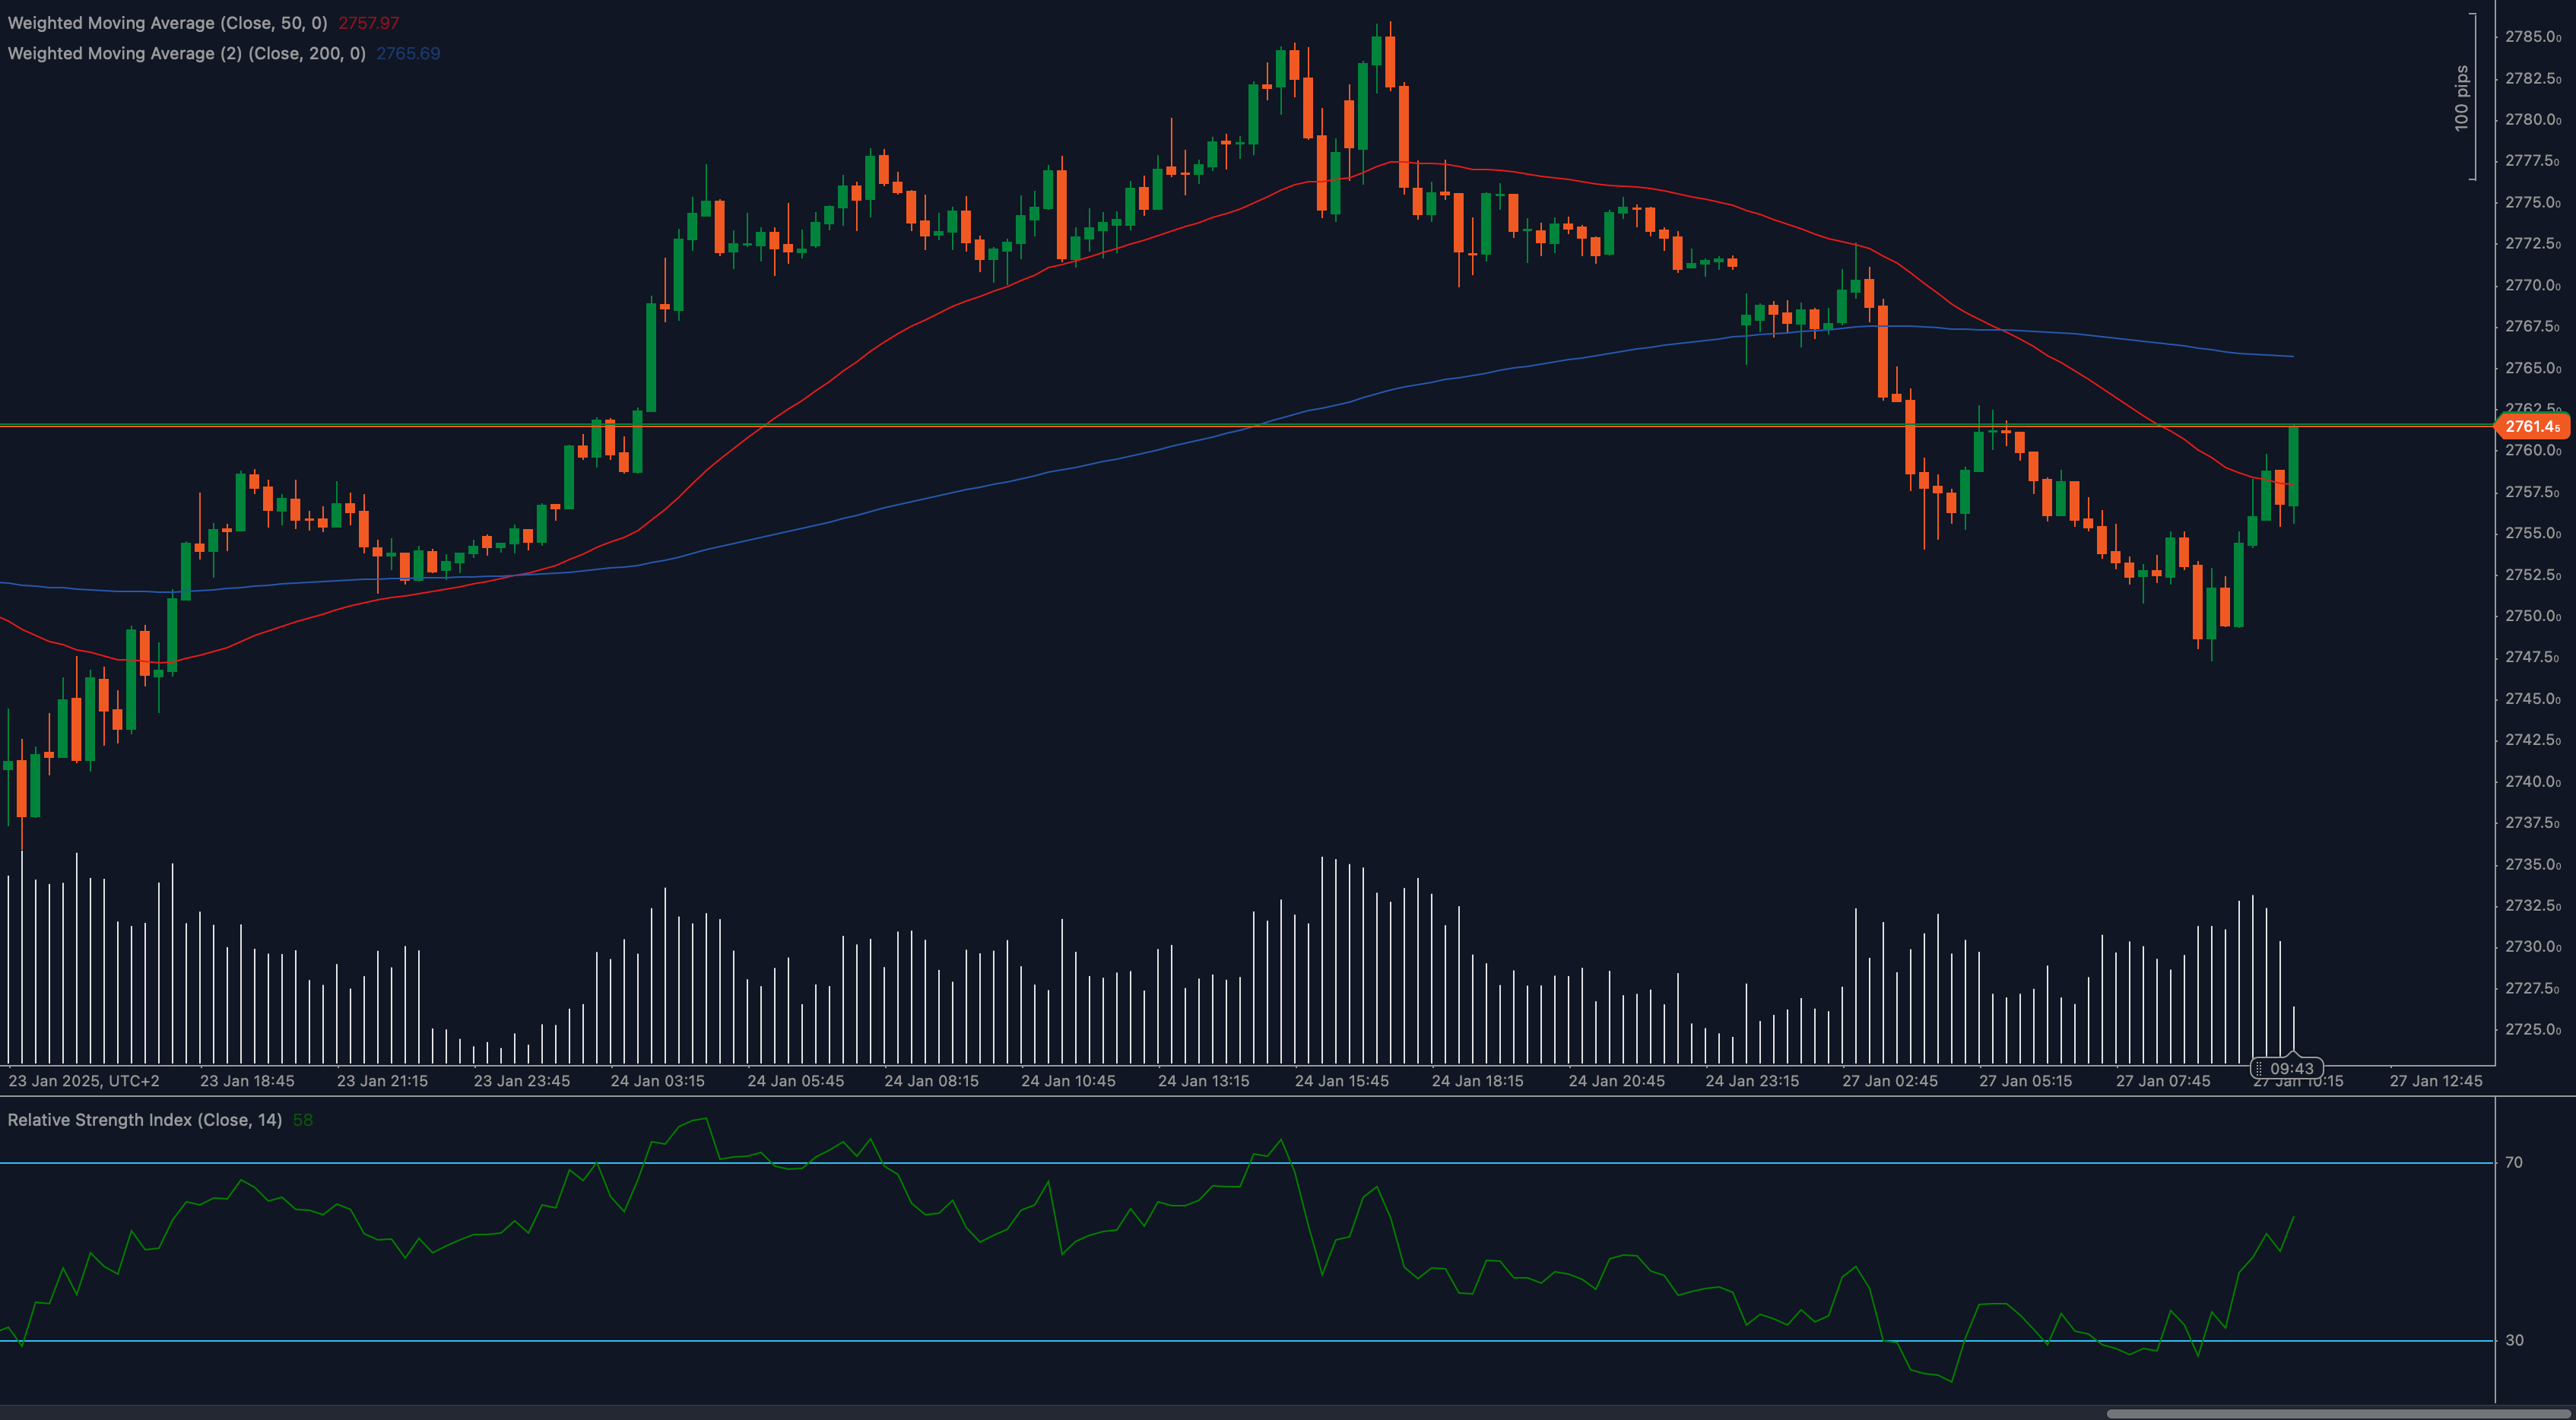
📈 Weighted Moving Averages Indicate Mixed Sentiment
The 50 Weighted Moving Average (WMA) at 2757.97 is trending below the 200 WMA at 2765.69, signaling a bearish trend overall. However, the recent recovery is challenging this narrative, with the price testing resistance at 2761.
📊 RSI Shows Bullish Momentum
The Relative Strength Index (RSI) is at 58, signaling improving bullish momentum. A rise above 60 RSI could indicate stronger buying interest and further upside potential for gold.
🔎 Fibonacci Levels Highlight Key Zones
A Fibonacci retracement from the recent swing low to the current high indicates that the 2761 resistance aligns closely with critical levels, making it a crucial zone for traders to watch.
Key Levels to Watch
Support Levels:
- 2750: Immediate support for potential pullbacks.
- 2730: Secondary support if selling pressure intensifies.
Resistance Levels:
- 2761: Immediate resistance where price is consolidating.
- 2765.69: Strong resistance tied to the 200 WMA.
Fundamental Drivers
Gold’s recovery is supported by geopolitical uncertainties and shifting expectations around global monetary policy. Recent hawkish signals from the Federal Reserve have pressured the yellow metal, but ongoing concerns over inflation and global risks continue to lend it support. Upcoming macroeconomic data, including U.S. inflation reports and central bank updates, are likely to dictate the next move for XAU/USD.
Outlook
Gold faces a pivotal moment at the 2761 resistance level. A successful breakout could pave the way for further gains toward 2765.69 and beyond, while failure to hold above this level may lead to consolidation or a pullback toward 2750.
Traders should closely monitor technical indicators like RSI and broader market sentiment to adapt their strategies accordingly.


