
The US Dollar Index (DXY) is attempting a recovery as it approaches the 107.70 resistance level, following a period of sharp declines. The current price action suggests a potential shift in momentum, though the index remains below its major moving averages.
Technical Analysis
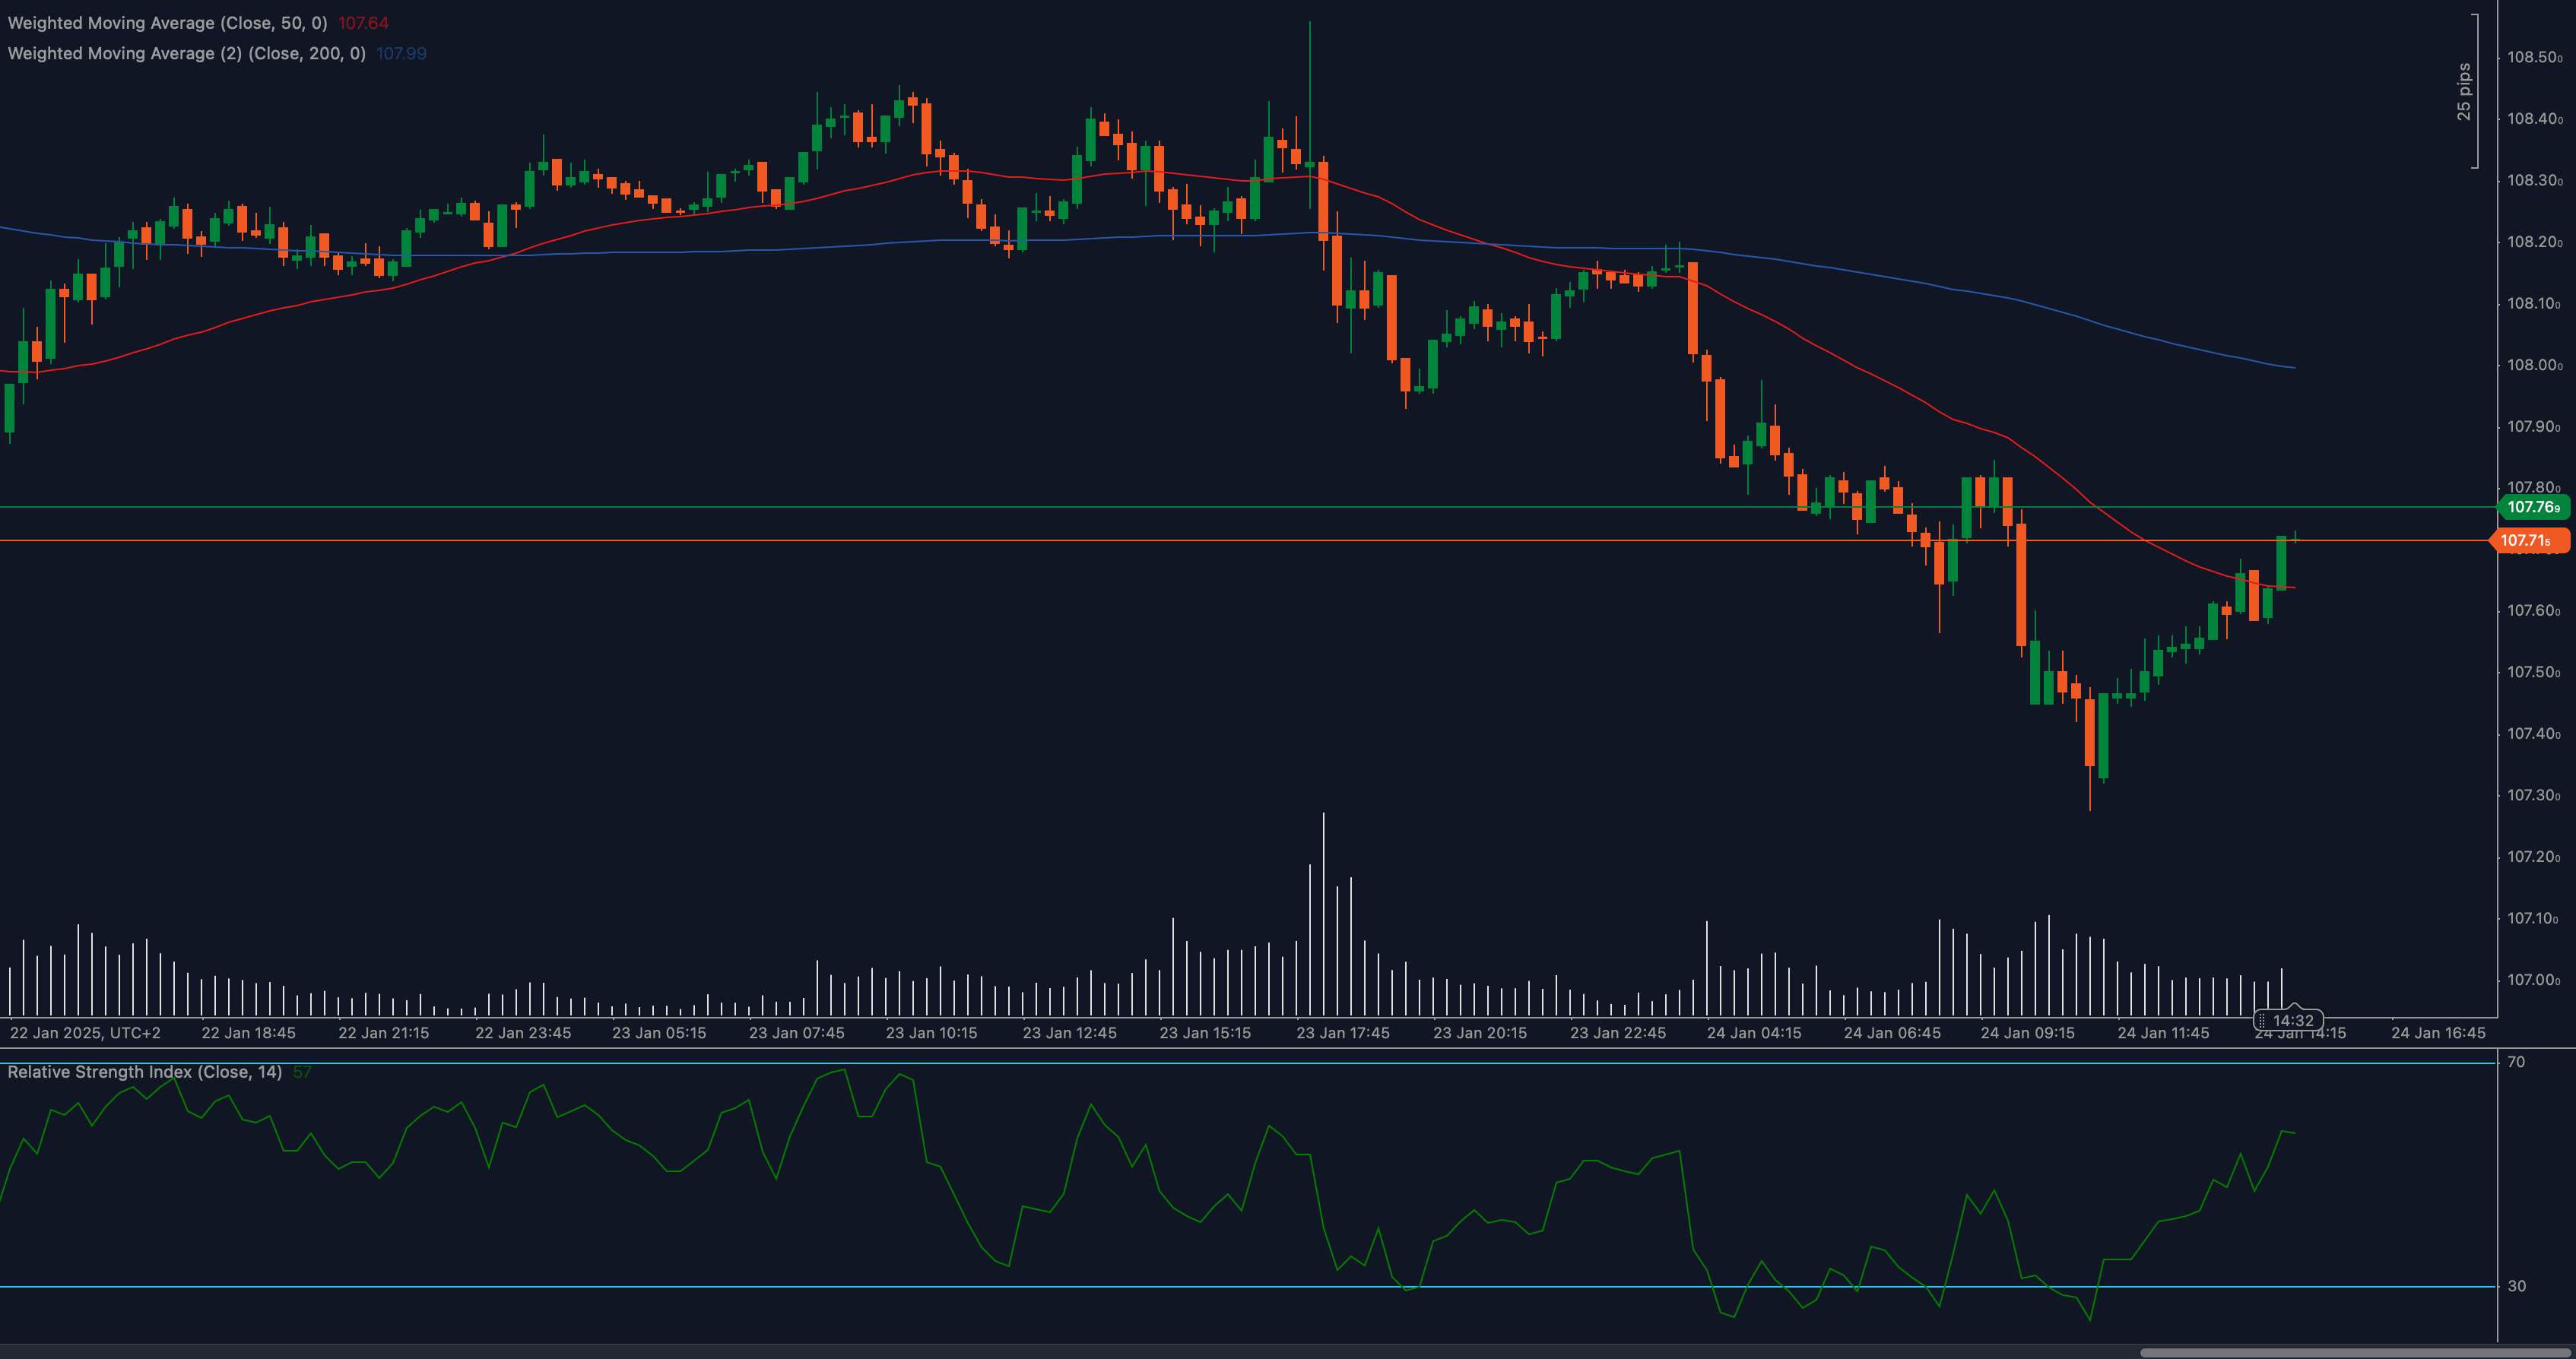
📈 Weighted Moving Averages Highlight Weakness
The 50 Weighted Moving Average (WMA) at 107.64 has crossed below the 200 WMA at 107.99, signaling a bearish trend. Despite the recovery attempt, the DXY remains vulnerable unless it can sustain levels above the 107.70 resistance.
📊 RSI Shows Improving Momentum
The Relative Strength Index (RSI) is currently at 57, indicating improving bullish momentum. A rise above 60 RSI would signal stronger buying interest, potentially supporting further gains.
🔎 Key Levels Indicate Consolidation Potential
The support zone is evident at 107.71, where the price previously held steady before the recent breakdown. The 107.99 level, corresponding to the 200 WMA, acts as immediate resistance if the index breaches 107.70.
Key Levels to Watch
Support Levels:
- 107.71: Immediate support at the recent recovery base.
- 107.50: Secondary support if momentum fades.
Resistance Levels:
- 107.70: Immediate resistance where price currently consolidates.
- 107.99: Key resistance tied to the 200 WMA.
Fundamental Drivers
The US Dollar Index faces pressure from mixed economic data and shifting expectations regarding the Federal Reserve’s monetary policy. Recent signs of resilience in the US economy, coupled with hawkish Fed rhetoric, have offered some support to the dollar. However, global risk appetite and geopolitical developments remain significant factors influencing the DXY. Upcoming data on GDP growth and core inflation will likely determine the next directional move.
Outlook
The US Dollar Index (DXY) is at a critical juncture, with 107.70 resistance acting as a key pivot. Sustaining gains above this level could signal a bullish recovery, targeting the 200 WMA at 107.99. However, failure to breach resistance may result in further consolidation or a retest of the 107.71 support zone.
Traders should watch momentum indicators like RSI and upcoming US economic data for clues on the next move.


