
📊 MARKET OVERVIEW
The UK100 index has entered a decisive bearish phase as it recently broke below the critical 7800 support level, a threshold that had previously provided robust price stability. This breakdown comes amid increasing market volatility and reflects growing investor concerns about the UK economic outlook. The price action reveals a clearly defined downtrend with lower highs and lower lows forming since early March, indicating strengthening bearish momentum. Trading volume has been notably elevated during recent selloffs, further confirming the strength behind this downward move as institutional investors appear to be repositioning their portfolios in response to changing market conditions.
Global economic uncertainties and specific concerns about UK economic growth projections have contributed to the current market sentiment, impacting the UK100’s performance. The index is now trading below both its 50-day and 200-day moving averages, a technical configuration that traditionally signals a bearish market structure for long-term investors and institutional funds analyzing the UK100 index for strategic positioning.
📈 TECHNICAL ANALYSIS
What Are the Key Support and Resistance Levels for UK100?
The UK100 index has broken below the crucial psychological support at 7800, which represents a significant technical development. This level had previously acted as strong support throughout late February and early March trading sessions. With prices now trading below this threshold, the 7800 level has transformed into immediate resistance. The next support zone lies around 7750-7780, an area that coincides with previous price consolidations from late February. Should this support fail to hold, traders should monitor the 7700 level as the next significant support zone.
On the resistance side, the immediate barrier exists at the recently broken 7800 level, followed by the 7820-7850 range where the 50-day moving average (currently at approximately 7820) provides additional technical resistance. A more significant resistance zone exists at the 7880-7900 range, which coincides with recent swing highs and the declining trendline connecting the recent lower highs. For any substantial bullish reversal to gain credibility, the UK100 would need to reclaim territory above the 7900 level with convincing volume.
Moving Average Analysis
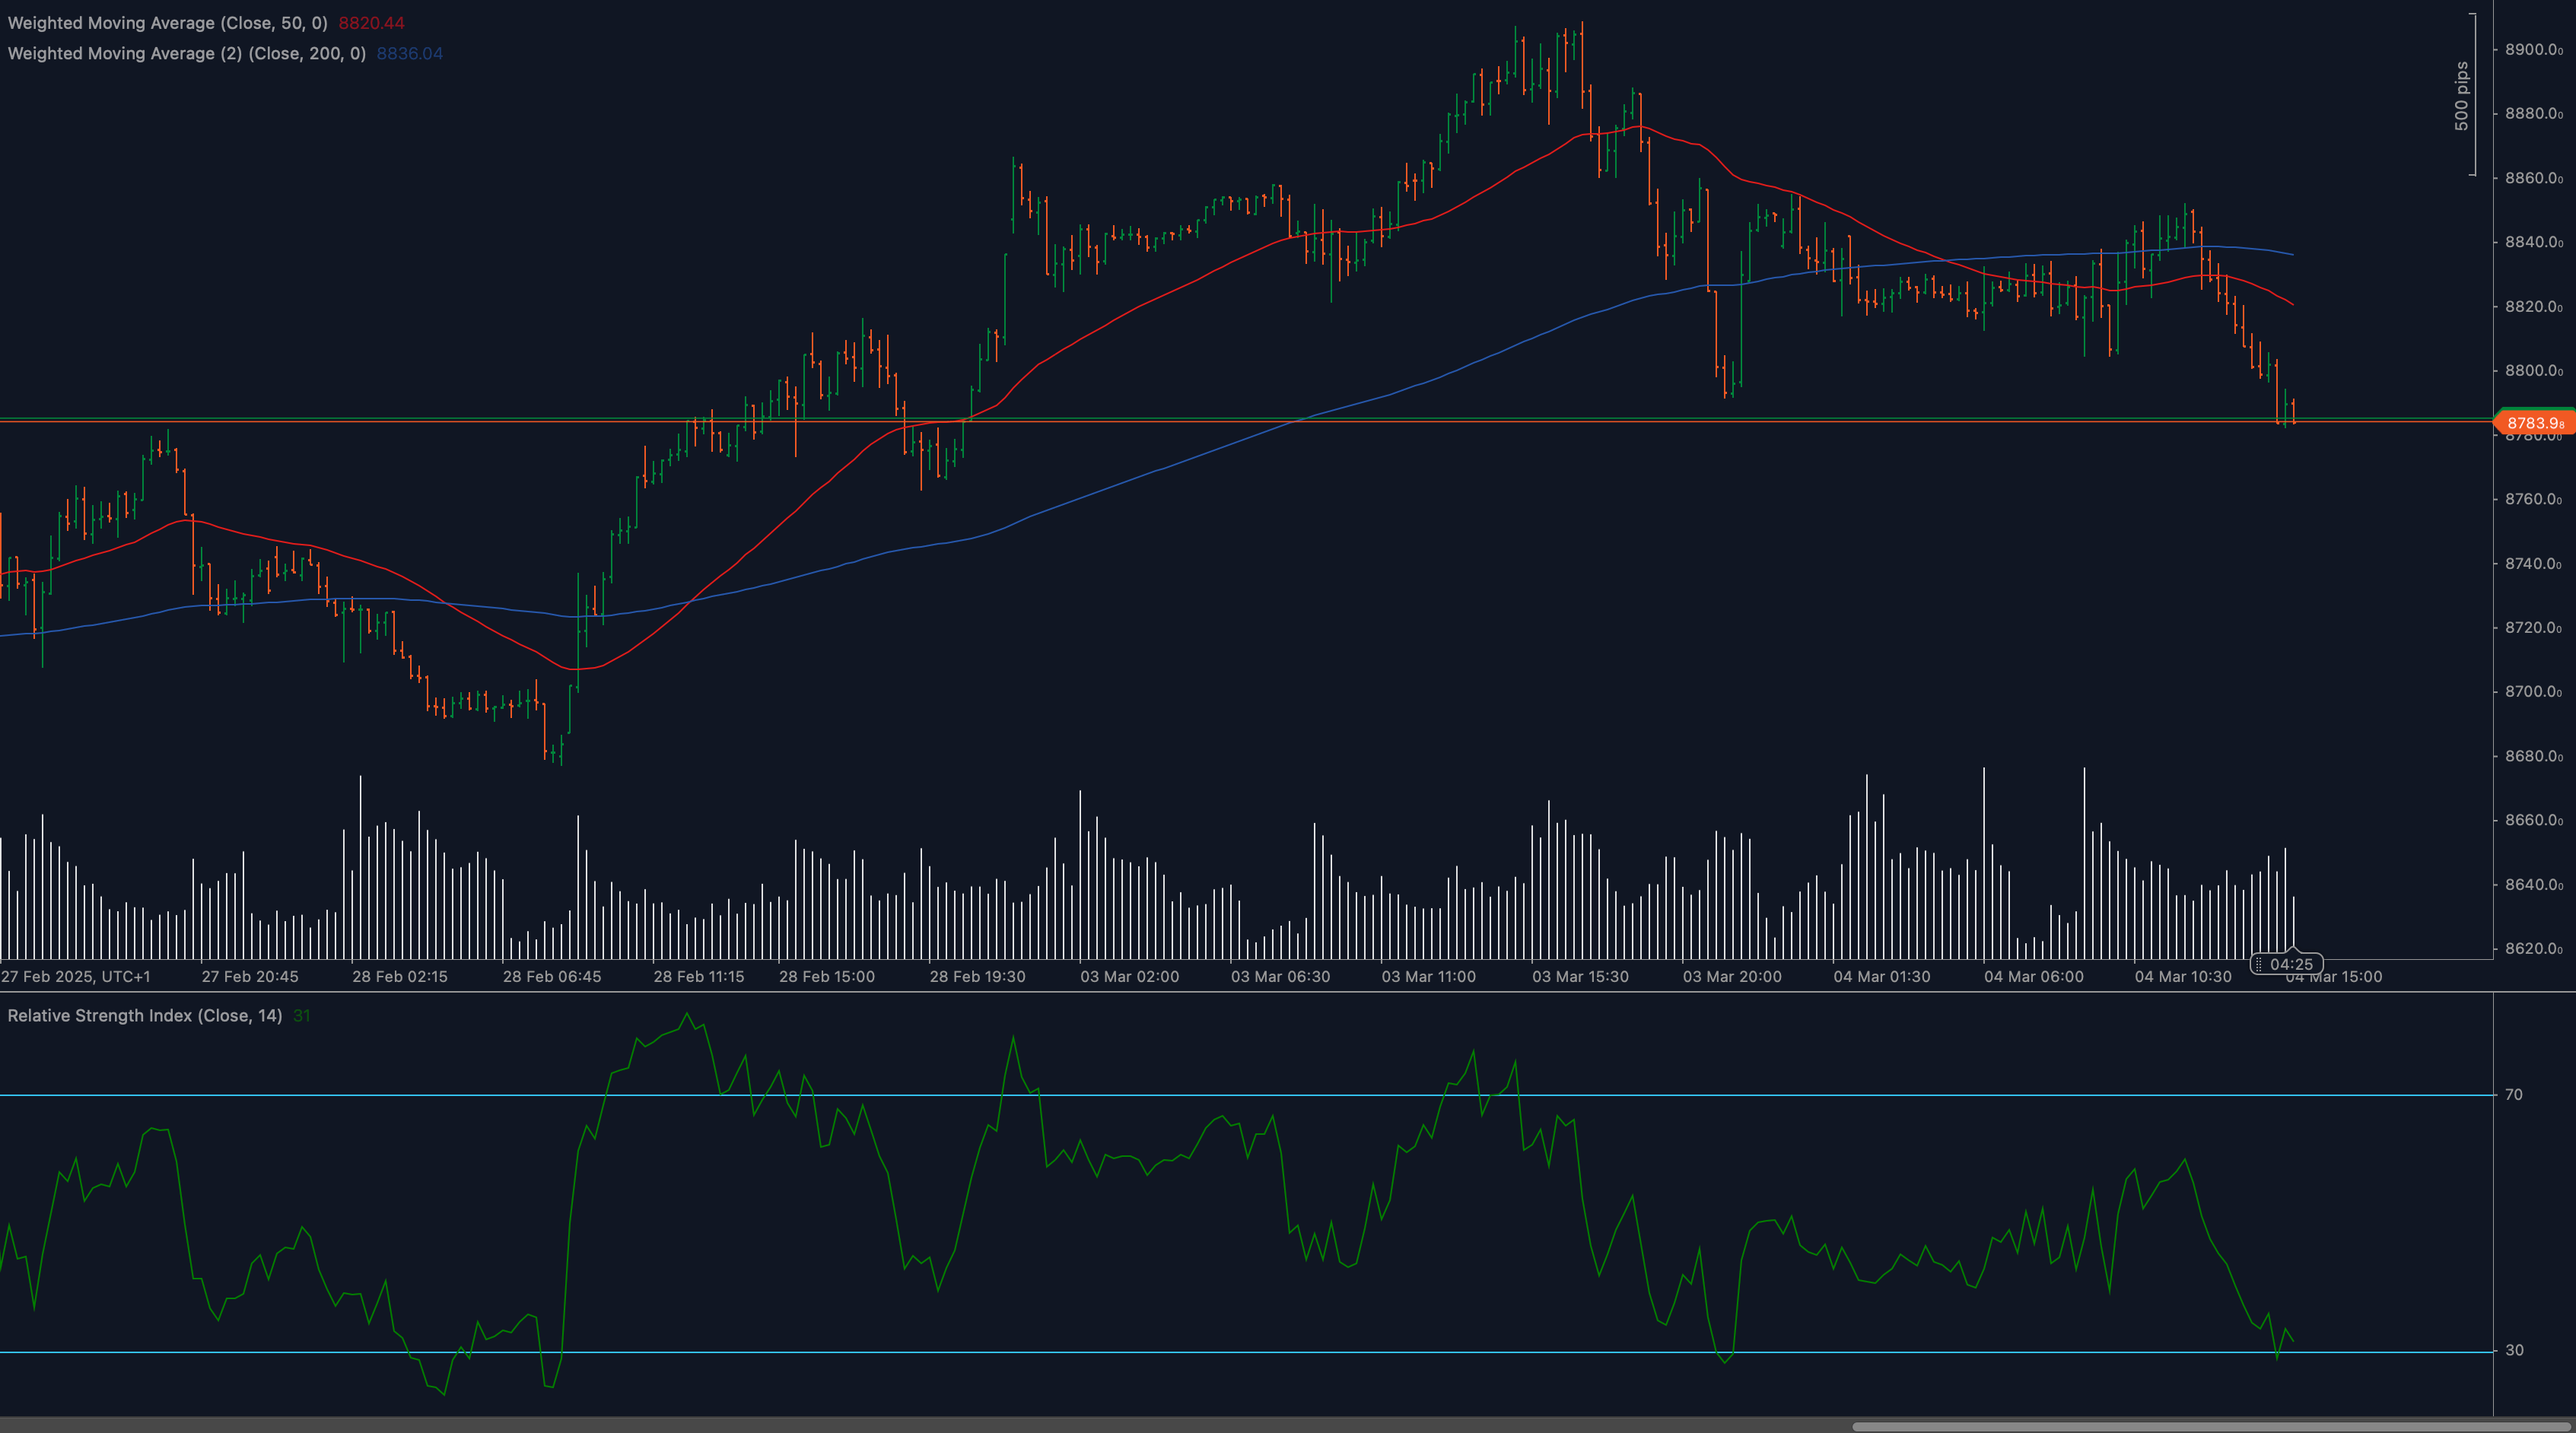
The moving average configuration presents a distinctly bearish picture for the UK100 index. The 50-day moving average (red line on the chart) has crossed below the 200-day moving average (blue line), forming what technical analysts refer to as a “death cross” – a traditionally bearish signal indicating potential for continued downside. Current price action is trading below both these significant moving averages, reinforcing the bearish bias in the medium term.
The 50-day moving average, currently around 7820, is now acting as dynamic resistance, with recent price rallies failing to break and hold above this level. This moving average alignment suggests that selling pressure remains dominant, with institutional algorithms likely programmed to sell rallies that approach these technical resistance levels. For the UK100 to establish a more constructive technical picture, price would need to reclaim territory above these moving averages with increased buying volume.
RSI Indicator Analysis
The 14-period Relative Strength Index (RSI) displayed in the lower panel of the chart reveals waning momentum. The RSI has recently declined from the mid-range values and is approaching the oversold territory (below 30), but has not yet reached extremely oversold conditions. This suggests there may still be room for further downside before a technical bounce becomes likely.
Notable divergences between price action and the RSI are absent, indicating that the current downtrend remains intact without underlying contradictory signals. Previous RSI readings show that the indicator has been making lower highs, corresponding with the price action’s lower highs, confirming the strength of the prevailing bearish trend in the UK100 index.
Price Action and Chart Patterns
The price action structure of the UK100 displays a series of lower highs and lower lows, the classic definition of a downtrend. The most recent price action shows aggressive selling with elongated bearish candles breaking below support, indicating strong conviction among sellers. The limited size of bullish candles during attempted recoveries suggests weak buying interest, a pattern that typically continues until a catalyst triggers a change in market sentiment.
The UK100 has formed a descending channel pattern over the recent trading sessions, with prices consistently respecting the upper and lower boundaries of this bearish formation. The recent breakdown below 7800 represents a breach of the channel’s lower boundary, potentially signaling an acceleration of the downtrend. For reversal signals, traders should watch for a potential double bottom formation or bullish engulfing patterns near the 7750 support level.
Fibonacci Retracement Levels
Applying Fibonacci retracement analysis to the recent decline from the March highs to current lows identifies key levels that may act as resistance during potential recovery attempts. The 38.2% retracement level aligns closely with the 7820 resistance zone, while the 50% retracement coincides with the 7850 area. These Fibonacci levels, reinforced by their confluence with other technical resistance points, create significant barriers for any bullish recovery scenarios in the UK100 index.
🔍 MARKET OUTLOOK & TRADING SCENARIOS
Bearish Scenario
The prevailing technical structure supports a continued bearish outlook for the UK100. In this scenario, prices would struggle to reclaim territory above the 7800 level and eventually break below the 7750 support. This could trigger a new wave of selling pressure, potentially driving the index toward the 7700 psychological support level. The bearish case gains further credibility if global economic concerns intensify or if UK-specific economic data disappoints investor expectations. Technical targets in this scenario would focus on the 7680-7700 range initially, with potential for extension toward the 7600 level should selling momentum accelerate.
Neutral Scenario
A neutral outlook would develop if the UK100 manages to stabilize around the current levels and begins forming a consolidation pattern. In this scenario, prices would oscillate between the 7750 support and 7850 resistance, effectively establishing a sideways trading range. This consolidation would likely persist until a significant economic catalyst or change in market sentiment provides directional clarity. The neutral case would be characterized by declining volume and narrowing Bollinger Bands, indicating decreasing volatility as the market awaits fresh directional drivers for the UK100 index.
Bullish Scenario
The bullish case, while currently less probable given the technical breakdown below 7800, would require the UK100 to quickly reclaim territory above this threshold with convincing volume. For this scenario to gain traction, prices would need to clear above the 50-day moving average (around 7820) and establish support above it. Such a development could potentially target the 7880-7900 resistance zone initially, with scope for a move toward 8000 if supported by improving economic fundamentals and renewed investor confidence. This scenario would likely be accompanied by a bullish divergence on the RSI and a notable increase in buying volume.
💼 TRADING CONSIDERATIONS
Traders approaching the UK100 in the current technical environment should prioritize risk management given the index’s volatile nature. For bearish positioning, considering short entries on rebounds that fail near the 7800 resistance level could offer favorable risk-reward profiles, with stops placed above the 50-day moving average. Target levels for such trades would focus on the 7750 support initially, with potential for extension toward 7700 if the downtrend accelerates.
For investors with a more balanced approach, waiting for clear reversal signals before establishing new positions would be prudent. Such signals might include a bullish engulfing pattern at support levels, accompanied by positive RSI divergence and increased buying volume. The daily timeframe should be complemented with analyses of lower timeframes (4-hour and 1-hour charts) to identify optimal entry points with tighter stop-loss parameters.
Position sizing should reflect the elevated volatility in the UK100, with smaller position sizes recommended until a clearer trend direction establishes. Traders should also monitor correlated markets, particularly other European indices and the GBPUSD currency pair, for confirmation signals. Sector rotation within the UK100 components could provide additional clues about potential index direction, with particular attention to financial and energy sectors that heavily influence the index’s overall performance.
🏁 CONCLUSION
The UK100 index has entered a technically significant phase with the breakdown below the critical 7800 support level. The bearish moving average configuration, declining RSI, and series of lower highs and lows all point toward continued downside pressure in the near term. Key levels to monitor include the immediate resistance at 7800-7820 and support at 7750-7780. While the primary scenario leans bearish, traders should remain alert for potential stabilization or reversal signals, particularly around the 7750 support zone where technical bounces might emerge.
Market participants should maintain disciplined risk management in trading the UK100, recognizing that the index’s future direction will likely be influenced by both technical factors and fundamental developments in the UK economy. The convergence of technical analysis with macroeconomic drivers will ultimately determine whether the current breakdown below 7800 represents the beginning of a more substantial decline or merely a temporary setback before stabilization and potential recovery in the UK100 index.
⚠️ DISCLAIMER:
This analysis is for informational purposes only and should not be considered financial advice. Trading carries risk, and past performance does not guarantee future results. Conduct independent research before making investment decisions.


