
📊 MARKET OVERVIEW
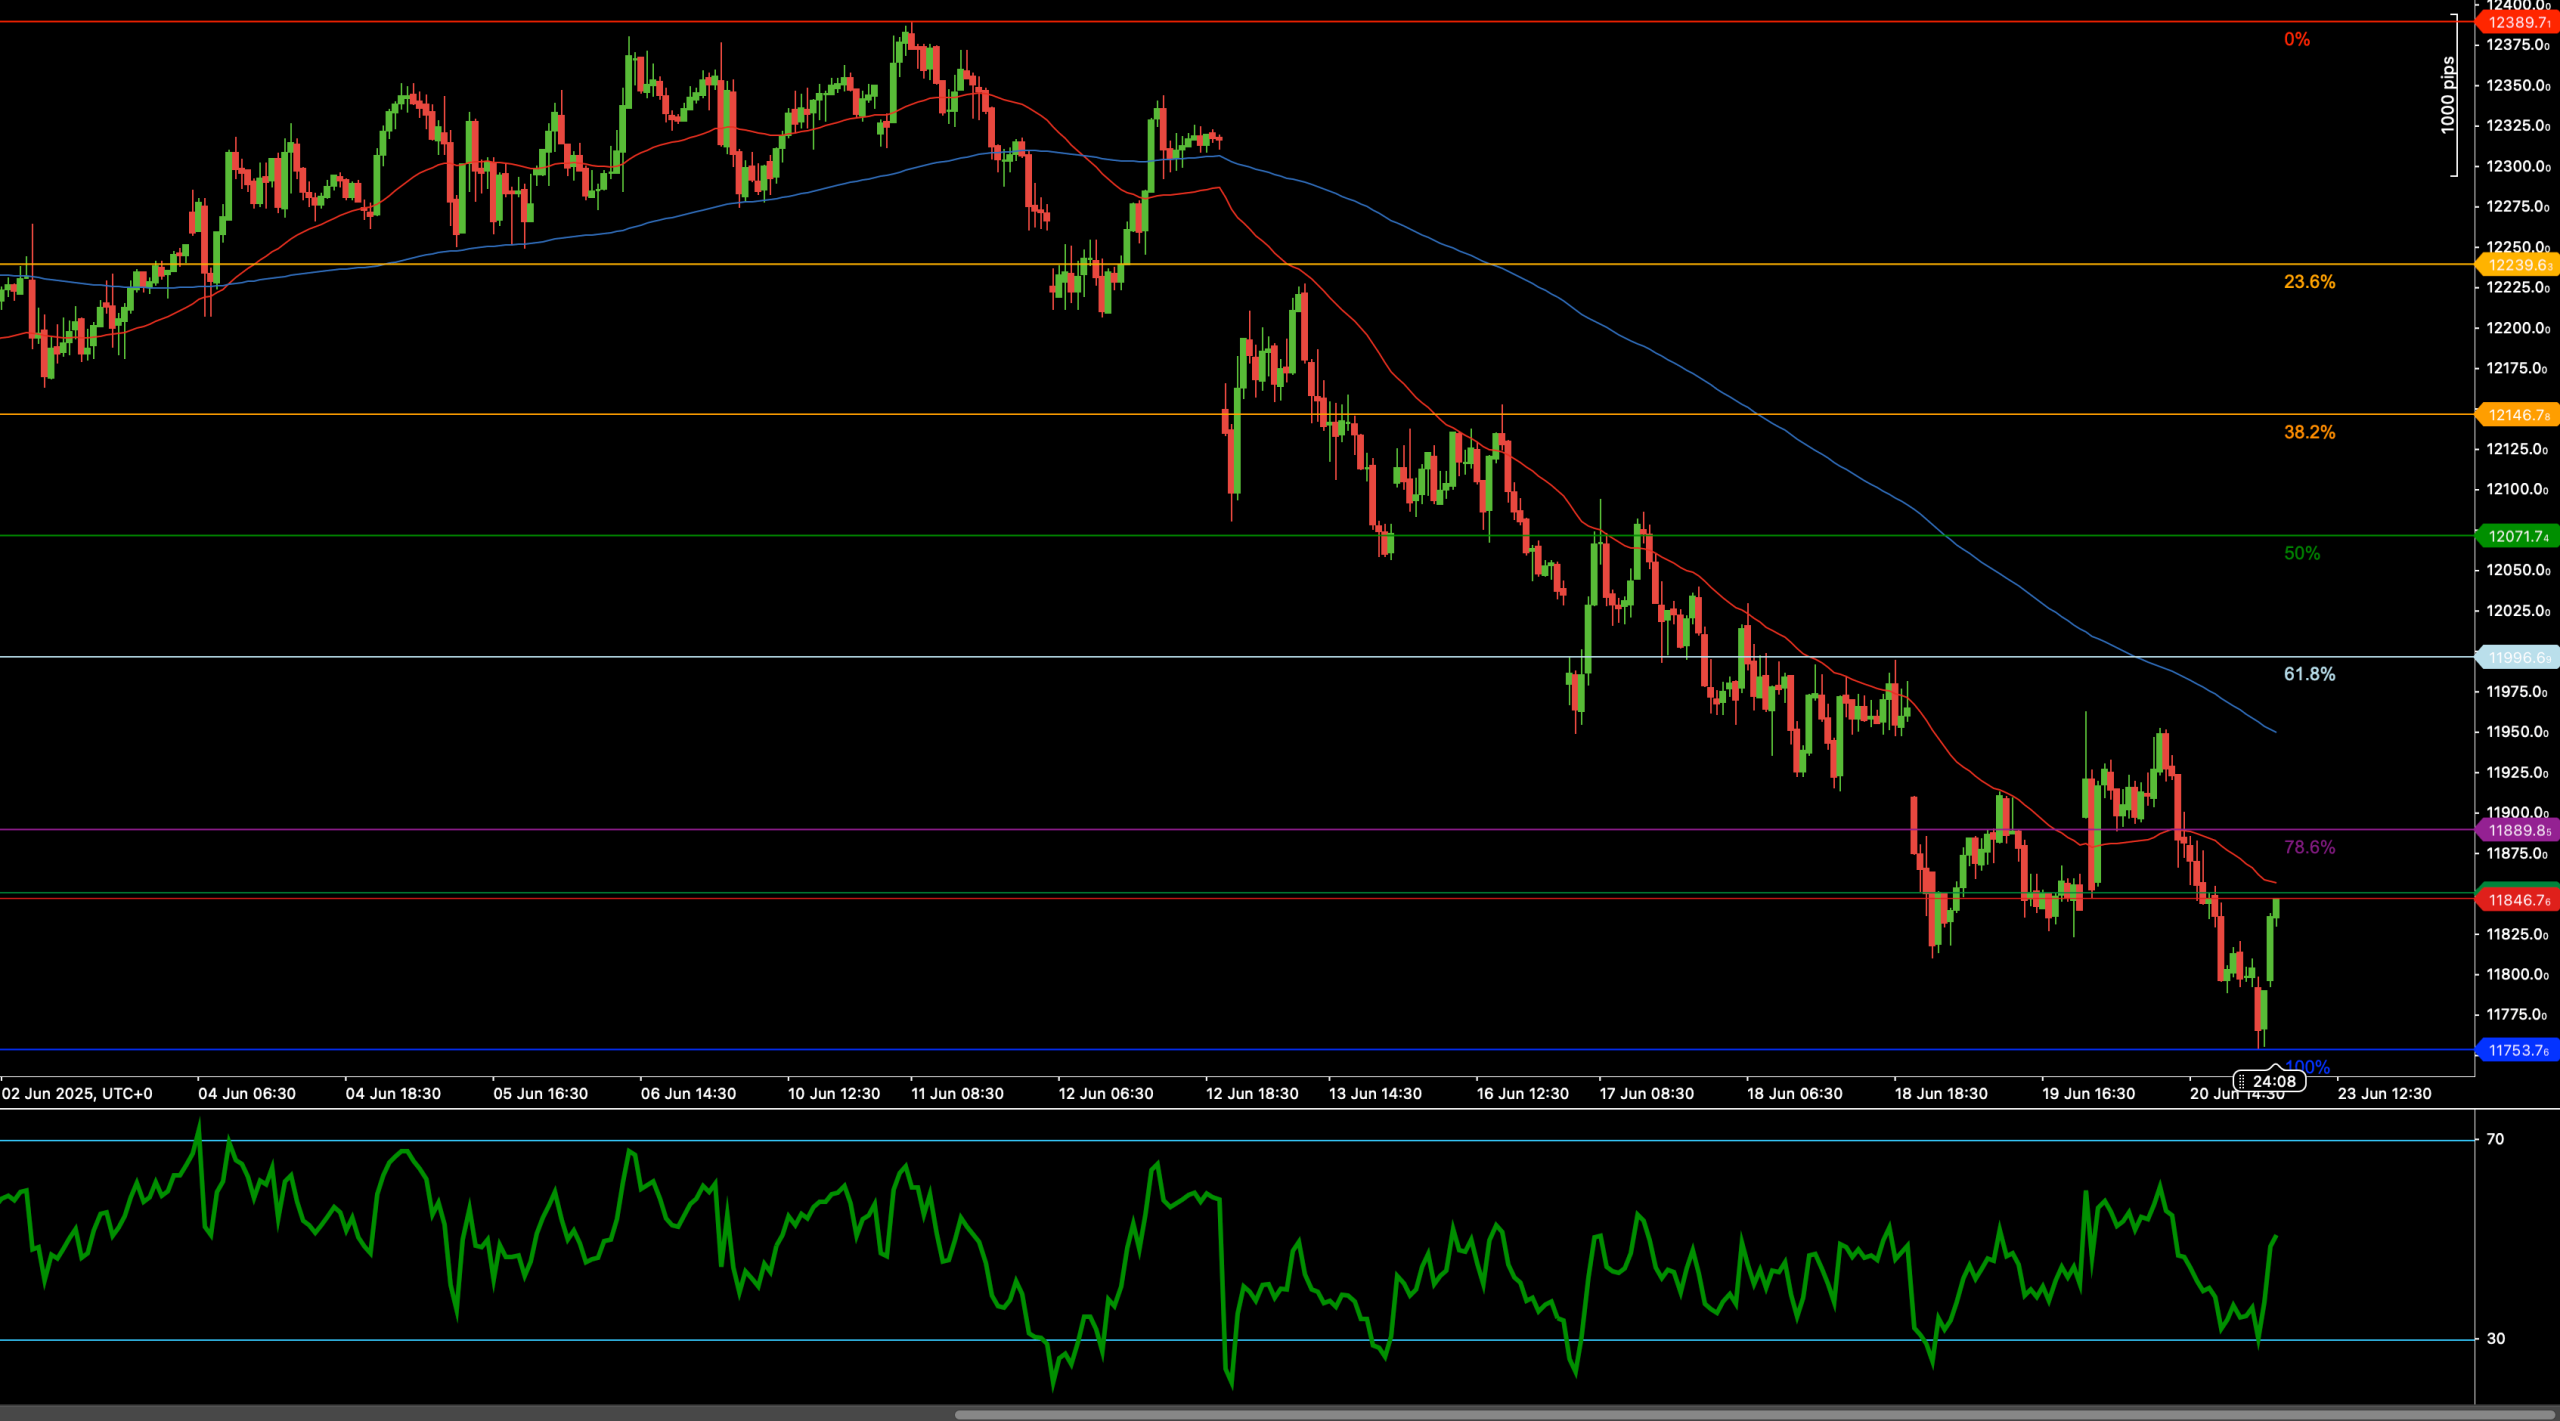
SMI20 remains locked in a sustained bearish trend, with the index now testing the full 100% Fibonacci retracement at 11,752 — marking a complete unwind of the prior bullish leg. Recent sessions have seen heavy downside pressure, driven by persistent weakness below both the 50-period and 200-period weighted moving averages, which continue to slope sharply lower.
The technical picture is bearish, but the 14-period RSI has now rebounded strongly from oversold territory, suggesting the potential for at least a short-term stabilization. However, until the index can reclaim key resistance levels, the broader trend bias remains negative. The reaction around 11,752 will now be pivotal in shaping whether SMI20 enters a consolidation phase or continues its downtrend.
📈 TECHNICAL ANALYSIS
Key Support and Resistance Levels
Immediate support is located at 11,752 (100% retracement). This is a key make-or-break level for the current bearish cycle. A sustained break below 11,752 would open the path toward new local lows, with next potential supports undefined below the current structure.
To the upside, first resistance is found at 11,885 (78.6% Fib) — a critical pivot for any bullish recovery attempt. Further resistance sits at 11,975 (61.8%), with the 12,071 (50%) and 12,146 (38.2%) levels marking deeper retracement zones. Bulls would need to clear at least 11,975 to ease current downside pressure.
Moving Averages and Dynamic Price Action
Price action remains firmly beneath both the 50-period and 200-period weighted moving averages, which are both trending lower and acting as dynamic resistance. The 50-WMA near 11,975 and the 200-WMA above 12,071 create a significant resistance band that will be difficult for bulls to overcome without a notable improvement in momentum.
As long as price remains below these averages, rallies are likely to be corrective in nature, with sellers ready to reassert control at key resistance levels.
RSI Momentum and Bearish Pressure
The 14-period RSI has rebounded sharply from oversold territory below 30, now approaching 45. This recovery signals that short-term bearish momentum may be fading. However, RSI remains below 50, so bullish conviction has yet to be confirmed.
If RSI can close above 50, it would suggest growing bullish intent and could support a bounce toward higher resistance levels. Conversely, if RSI stalls below 50, it would confirm that the broader bearish structure remains dominant.
Candlestick Behavior and Price Action Clarity
Recent candlesticks show signs of stabilization near 11,752, with long lower wicks indicating buying interest emerging at key support. However, bullish body size remains limited and no strong reversal patterns have yet formed.
A bullish engulfing pattern or impulsive breakout candle above 11,885 would strengthen the recovery case. Until such confirmation appears, sellers are likely to retain the upper hand.
Chart Structure and Breakdown Formation
Structurally, SMI20 remains entrenched in a clear downtrend, with a well-defined series of lower highs and lower lows. The recent test of 11,752 marks an important inflection point — whether this results in a base-building effort or continued downside remains to be seen.
A failure to hold above 11,752 would likely confirm the continuation of the prevailing bearish cycle and expose the index to deeper downside risk.
Fibonacci Retracement and Extension Levels
The Fibonacci retracement grid from 12,389 (swing high) to 11,752 (recent low) outlines the key technical roadmap. The current bounce attempt is testing the 11,885 (78.6%) zone, with additional resistance at 11,975 (61.8%) and 12,071 (50%).
Sustained rejection at these levels would likely trigger renewed selling interest, while a breakout above 12,071 would provide the first real signal of a potential trend shift.
🔍 MARKET OUTLOOK & TRADING SCENARIOS
Bullish Scenario
A bounce above 11,885, with RSI moving through 50 and price reclaiming 11,975, could trigger a recovery leg toward 12,071 and possibly 12,146. This would require strong buying interest and clear bullish price action confirmation.
Neutral Scenario
A range-bound consolidation between 11,752–11,885 may emerge if bulls defend support but lack the strength for a decisive breakout. RSI stabilizing between 45–50 would reflect this neutral posture.
Bearish Scenario
A confirmed breakdown below 11,752, combined with RSI rolling back below 40, would reinforce bearish momentum and open the door for a continuation of the downtrend toward new lows.
💼 TRADING CONSIDERATIONS
Bullish setup: Watch for bullish reversal signals above 11,885 with RSI above 50. Targets: 11,975–12,071. Stops below 11,752.
Bearish setup: Short entries favored on rejection of 11,885 or breakdown below 11,752. Targets: new lows below current support. Stops above 11,885.
Risk context: While RSI rebound offers near-term support, prevailing trend structure still favors bears unless key resistances are reclaimed.
🏁 CONCLUSION
SMI20 remains under bearish control as the index tests the 100% retracement at 11,752. Although RSI is showing recovery from oversold conditions, price remains well below key moving averages, keeping the broader trend under pressure. Unless buyers can force a break above 11,885 and reclaim higher levels, the risk of further downside remains elevated. The coming sessions will be critical in determining whether this marks a short-term bottom or continuation of the broader decline.
⚠️ DISCLAIMER
This analysis is for informational purposes only and does not constitute financial advice. Always consult with a licensed financial professional before making trading decisions.


