
📊 MARKET OVERVIEW
The SMI20 index has posted a recovery over recent sessions, but is now consolidating directly beneath the important resistance level at 11,445. This area marks the upper boundary of a broader consolidation zone that has persisted for much of April. Although bullish momentum supported the recent move up, signs of fatigue are emerging.
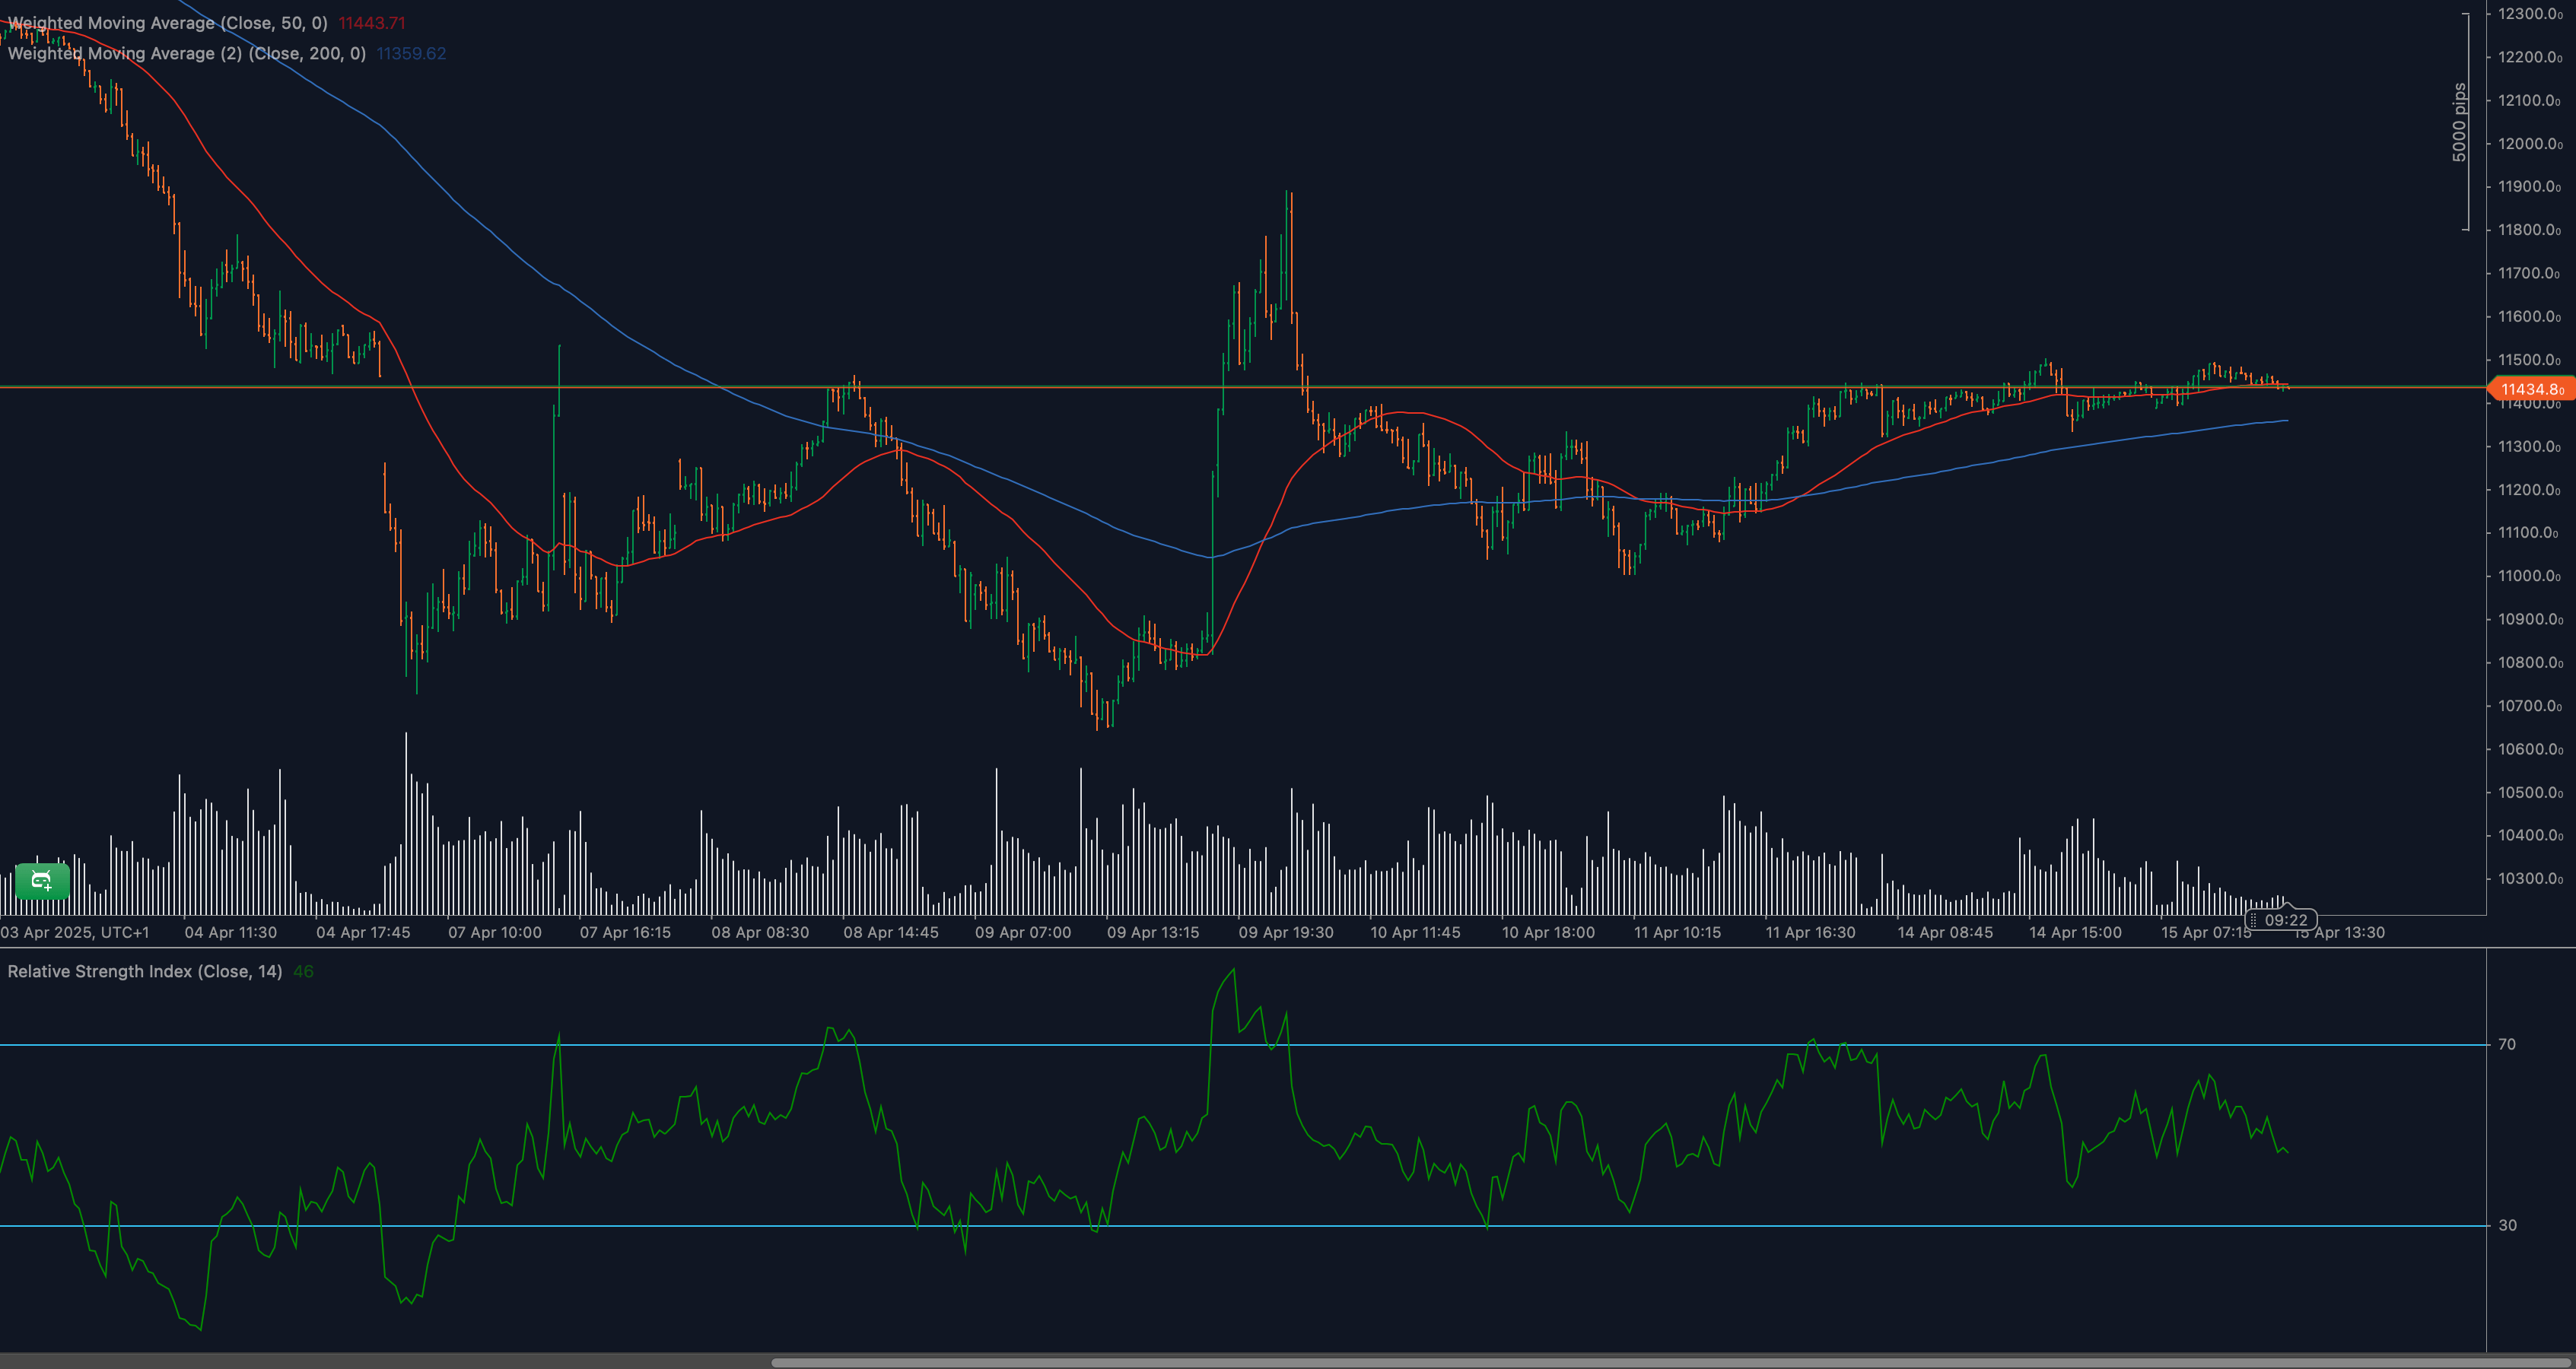
Price remains above both the 50- and 200-period moving averages, reinforcing a constructive technical backdrop. However, RSI has begun to roll over, and volume has gradually diminished, suggesting that buying strength may be waning. The market’s reaction at this resistance will likely define the next directional phase for the index.
📈 TECHNICAL ANALYSIS
What Are the Key Support and Resistance Levels for SMI20?
Immediate resistance is at 11,445, where price has been repeatedly rejected since April 11. A confirmed breakout above this zone would open the path toward 11,600 and 11,750. To the downside, the first support is seen around 11,300, followed by 11,150, which aligns with a prior breakout area. If selling intensifies, 10,980 becomes the next significant downside target.
Moving Average Analysis and Dynamic Price Levels
The 50-period WMA is currently trending upward near 11,444, aligning closely with horizontal resistance. The 200-period WMA is flatter but supportive around 11,358. Price is currently holding just above both averages, signaling that bulls are still in control structurally. However, any slip back below the 50-WMA could shift short-term sentiment quickly.
RSI Momentum Analysis and Divergence Patterns
RSI (14) has drifted lower from a recent high near 64 and now reads around 46. This reflects fading upside momentum. The recent lower high in RSI, while price continued higher, may be a sign of bearish divergence — an early warning that a reversal or consolidation phase may be developing. If RSI dips below 40, the case for bearish continuation strengthens.
Price Action and Candlestick Analysis
Candlestick formations near resistance have been indecisive, with multiple doji and spinning top candles showing market hesitation. While the index has not produced any clear bearish reversal pattern yet, the failure to push beyond 11,445 after multiple attempts indicates waning buying interest. A strong bullish close above this level would be needed to reassert momentum.
Chart Patterns and Formation Analysis
SMI20 is forming what resembles a horizontal consolidation or potential ascending triangle pattern, with rising support and a flat resistance cap at 11,445. These formations often precede breakouts, but only if supported by volume and momentum. Without renewed bullish participation, the pattern risks invalidation and could turn into a double top.
Fibonacci Retracement Levels and Extension Targets
Applying Fibonacci retracement from the April swing low near 10,600 to the 11,445 high, the 38.2% retracement rests at 11,150, and the 61.8% level at 10,950. These zones will be important downside targets if price fails at resistance. On the upside, a breakout above 11,445 opens the door to the 127.2% extension at 11,600 and the 161.8% extension near 11,750.
🔍 MARKET OUTLOOK & TRADING SCENARIOS
Bullish Scenario for SMI20
If price breaks above 11,445 with a strong bullish candle and RSI returning above 55, buyers could take control. This would likely trigger a push toward 11,600 and 11,750. Confirmation from increasing volume and a bullish moving average crossover would support this case.
Neutral Scenario for SMI20
If the index continues ranging between 11,300 and 11,445, the outlook remains neutral. Traders may consider range strategies until a breakout confirms new direction. RSI holding between 45 and 55 and flat candles near resistance would reinforce the sideways thesis.
Bearish Scenario for SMI20
A breakdown below 11,300 would invalidate the bullish structure and open up space toward 11,150 and potentially 10,950. RSI dropping below 40 and a daily close below the 50-WMA would strengthen the bearish outlook. Failed breakout attempts at 11,445 followed by high-volume selling would be a strong bearish trigger.
💼 TRADING CONSIDERATIONS
With the index consolidating at resistance, traders should focus on breakout confirmation above 11,445 or breakdown confirmation below 11,300. In either case, entries should be supported by RSI trend alignment and volume confirmation. Conservative traders may wait for a daily close to validate the move.
Stop-losses can be placed just above or below recent intraday extremes depending on the chosen direction. Partial profit-taking zones can be structured around Fibonacci targets or key historical pivots such as 11,150 and 11,600. Risk management remains key, especially in a low-volume, indecisive environment.
🏁 CONCLUSION
The SMI20 is approaching a pivotal point beneath the 11,445 resistance. While structural support remains in place, momentum is showing signs of weakening. Whether the index breaks higher or reverses depends heavily on the coming sessions’ price action and RSI behavior. Traders should be prepared for either outcome and ready to act on confirmation with disciplined risk control.
⚠️ DISCLAIMER
This analysis is for informational purposes only and does not constitute investment advice. Trading financial markets carries risk and may not be suitable for all investors. Always perform your own research and consult with a licensed financial professional before trading.


