
📊 MARKET OVERVIEW
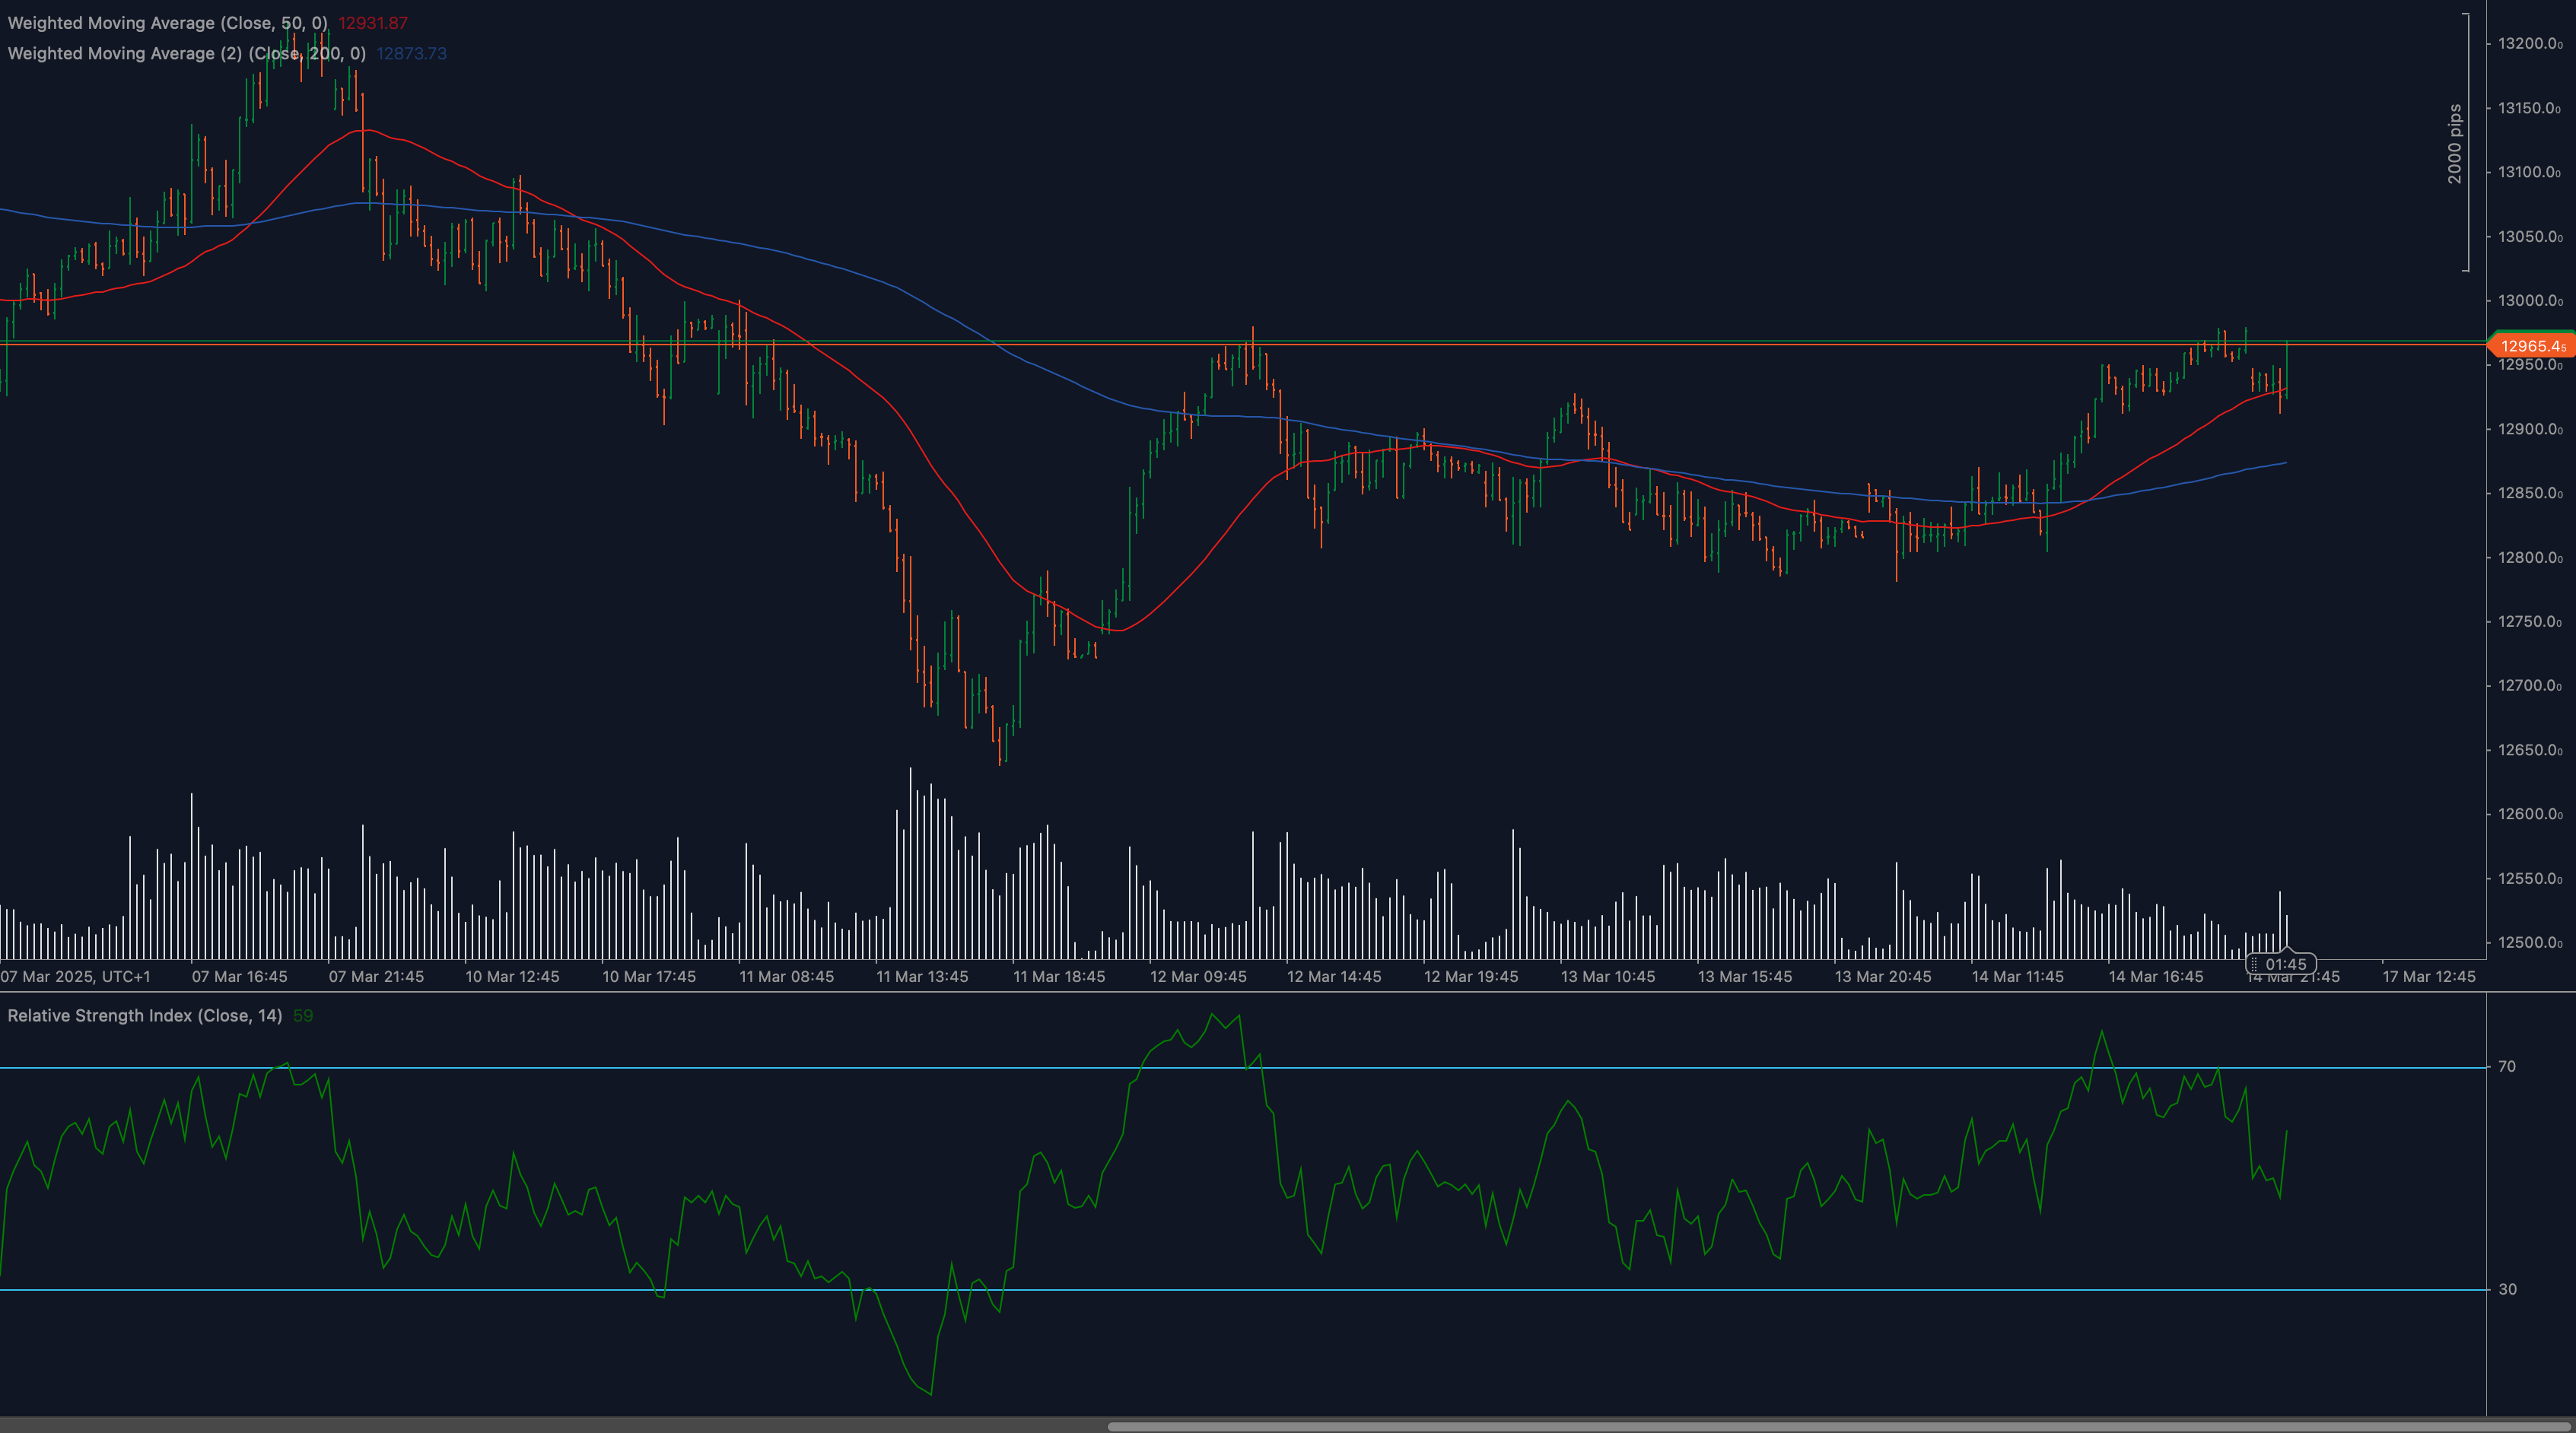
The Swiss Market Index (SMI20) is currently navigating a critical juncture as it tests the significant 12950 resistance level, which has previously acted as both support and resistance. Looking at the chart, we can see that after a substantial recovery from the 12650 lows, the index has formed a golden cross pattern with the 50-day moving average crossing above the 200-day moving average, traditionally seen as a strong bullish signal. This comes amid improving market sentiment for Swiss equities, with the RSI indicator showing positive momentum above the 50 level.
📈 TECHNICAL ANALYSIS
What Are the Key Support and Resistance Levels for SMI20?
The SMI20 is currently facing immediate resistance at the 12950 level, which represents a significant technical barrier that has rejected price advances multiple times in the recent trading sessions. This level is clearly visible on the chart as a horizontal line that has acted as both support and resistance in the past. If broken decisively, the next major resistance would likely come at the 13100 level. On the downside, the index has established support at 12850, followed by a stronger support zone around 12750-12780. The recent price structure suggests these support levels are gaining strength as buyers step in at these areas.
Moving Average Analysis and Dynamic Price Levels
A significant technical development is the recent golden cross formation, where the 50-day moving average (red line) has crossed above the 200-day moving average (blue line). This crossover is traditionally interpreted as a strong bullish signal, indicating a potential shift from a bearish to a bullish intermediate-term trend. The price is currently trading above both moving averages, which now act as dynamic support levels. The 50-day MA around 12870 should provide immediate support, while the 200-day MA near 12820 represents a stronger support zone that could attract buyers if tested.
RSI Momentum Analysis and Divergence Patterns
The Relative Strength Index (RSI) is currently reading around 65, indicating positive momentum without reaching overbought territory (typically considered above 70). The RSI has been making higher lows in recent weeks, confirming the price uptrend. There’s no significant divergence present between price and RSI, suggesting the current trend has healthy momentum behind it. The RSI has recently bounced from the 50 midline, which often acts as a dividing line between bullish and bearish momentum, further supporting the case for continued upside potential.
Price Action and Candlestick Analysis
Recent candlestick patterns show a series of higher lows forming as the SMI20 approaches the 12950 resistance level. We can observe several bullish candlesticks with strong bodies and minimal upper wicks near the resistance, suggesting buying pressure. However, the last few candles show some hesitation with smaller bodies and increased shadows, indicating a battle between buyers and sellers at the current levels. The candlestick formations suggest that while there is some selling pressure at resistance, buyers remain active on pullbacks.
Chart Patterns and Formation Analysis
The SMI20 has formed a rounded bottom pattern over the past month, which is typically considered a bullish reversal pattern. This formation occurred after a decline from the previous highs and suggests accumulation by investors. The recent price action has also created an ascending triangle pattern as the index repeatedly tests the 12950 resistance while making higher lows. This pattern often resolves to the upside and could target the 13150-13200 area if the breakout occurs with sufficient volume.
Fibonacci Retracement Levels and Extension Targets
While not explicitly marked on the chart, we can infer Fibonacci relationships based on the visible price movements. The recent rally from the 12650 lows to the current levels near 12950 represents a significant recovery. If we project Fibonacci extension levels from this move, potential targets on a breakout above 12950 would be around 13100 (1.27 extension) and 13250 (1.618 extension). On the downside, the 38.2% Fibonacci retracement of the recent rally would coincide with the 50-day moving average, reinforcing that support level.
🔍 MARKET OUTLOOK & TRADING SCENARIOS
Bullish Scenario for SMI20
In the bullish scenario, the SMI20 breaks convincingly above the 12950 resistance with increased volume, confirming the golden cross signal and the ascending triangle breakout. This would likely trigger a move toward the 13100 level initially, with potential to extend toward 13250-13300 in the coming weeks. The RSI would likely push into the 70-80 range, indicating strong bullish momentum. This scenario is supported by the positive moving average configuration and the current trend of higher lows.
Neutral Scenario for SMI20
In a neutral scenario, the SMI20 continues to consolidate between the 12850 support and 12950 resistance, forming a tighter range. The moving averages would continue to provide dynamic support, but the lack of a decisive breakout would suggest indecision among market participants. The RSI would likely oscillate between 45-65, neither confirming nor negating the bullish bias. This consolidation could persist until a significant catalyst emerges to drive the next directional move.
Bearish Scenario for SMI20
If the SMI20 fails to break above 12950 and instead falls below the 50-day moving average and the 12850 support, it could signal a false breakout and lead to a test of the 12750-12780 support zone. A break below this area would bring the 200-day moving average into focus as the next support. In this scenario, the RSI would likely drop below 50 and potentially test the 40 level, indicating diminishing bullish momentum. Volume would be a key factor to watch, as increased selling volume would add credibility to the bearish reversal.
💼 TRADING CONSIDERATIONS
When trading the SMI20 index at current levels, it’s crucial to respect the significance of the 12950 resistance. Consider using a breakout strategy with confirmation—look for a close above this level with above-average volume before establishing long positions. Setting a stop-loss just below the 50-day moving average around 12850 would provide a reasonable risk parameter.
For risk management, consider that the Swiss market can be sensitive to both domestic economic data and broader European sentiment shifts. Position sizing should account for the current average true range (ATR) of the SMI20, which has been showing moderate volatility.
Traders might consider scaling into positions rather than taking a full-size entry, given the proximity to significant resistance. This approach allows for averaging in at potentially better prices if the initial breakout experiences a retest.
For those looking at SMI20 futures or ETFs, watch for alignment with options market sentiment and institutional positioning for confirmation of the technical signals. The current golden cross setup is attractive for swing traders with a 2-4 week horizon, while day traders might focus on the immediate reaction to the 12950 level.
🏁 CONCLUSION
The SMI20 is presenting a compelling technical picture with the recent golden cross formation and test of the 12950 resistance level. The positive alignment of moving averages, bullish RSI momentum, and the pattern of higher lows all suggest potential for a breakout in the coming sessions. However, the resistance at 12950 has proven significant and will require decisive buying pressure to overcome.
Traders should remain vigilant about volume patterns and potential catalysts that could drive the next move. With proper risk management and attention to confirmation signals, the current setup offers interesting opportunities in both breakout and reversal scenarios. The Swiss market’s relative stability compared to some European counterparts adds to the appeal of this potential setup for technical traders.
⚠️ DISCLAIMER
This technical analysis of the SMI20 index is provided for informational purposes only and does not constitute investment advice. Financial markets involve risk, and past performance is not indicative of future results. All trading or investment decisions should be made based on your own research, experience, and financial situation. Always consider consulting with a qualified financial advisor before making investment decisions. The author and publisher assume no liability for any losses that may result from using the information contained in this analysis.


