
📊 MARKET OVERVIEW
The SMI20 index continues to trade in a tight consolidation range, currently capped by resistance at 11,920. After a strong rally from mid-April lows, the index has struggled to break higher, despite maintaining a structurally bullish posture above key moving averages.
Momentum indicators have leveled off, and volume has declined significantly compared to the breakout sessions, suggesting traders are waiting for a clear signal before committing further capital. Whether SMI20 breaks through resistance or pulls back toward support will likely define the next key move.
📈 TECHNICAL ANALYSIS
What Are the Key Support and Resistance Levels for SMI20?
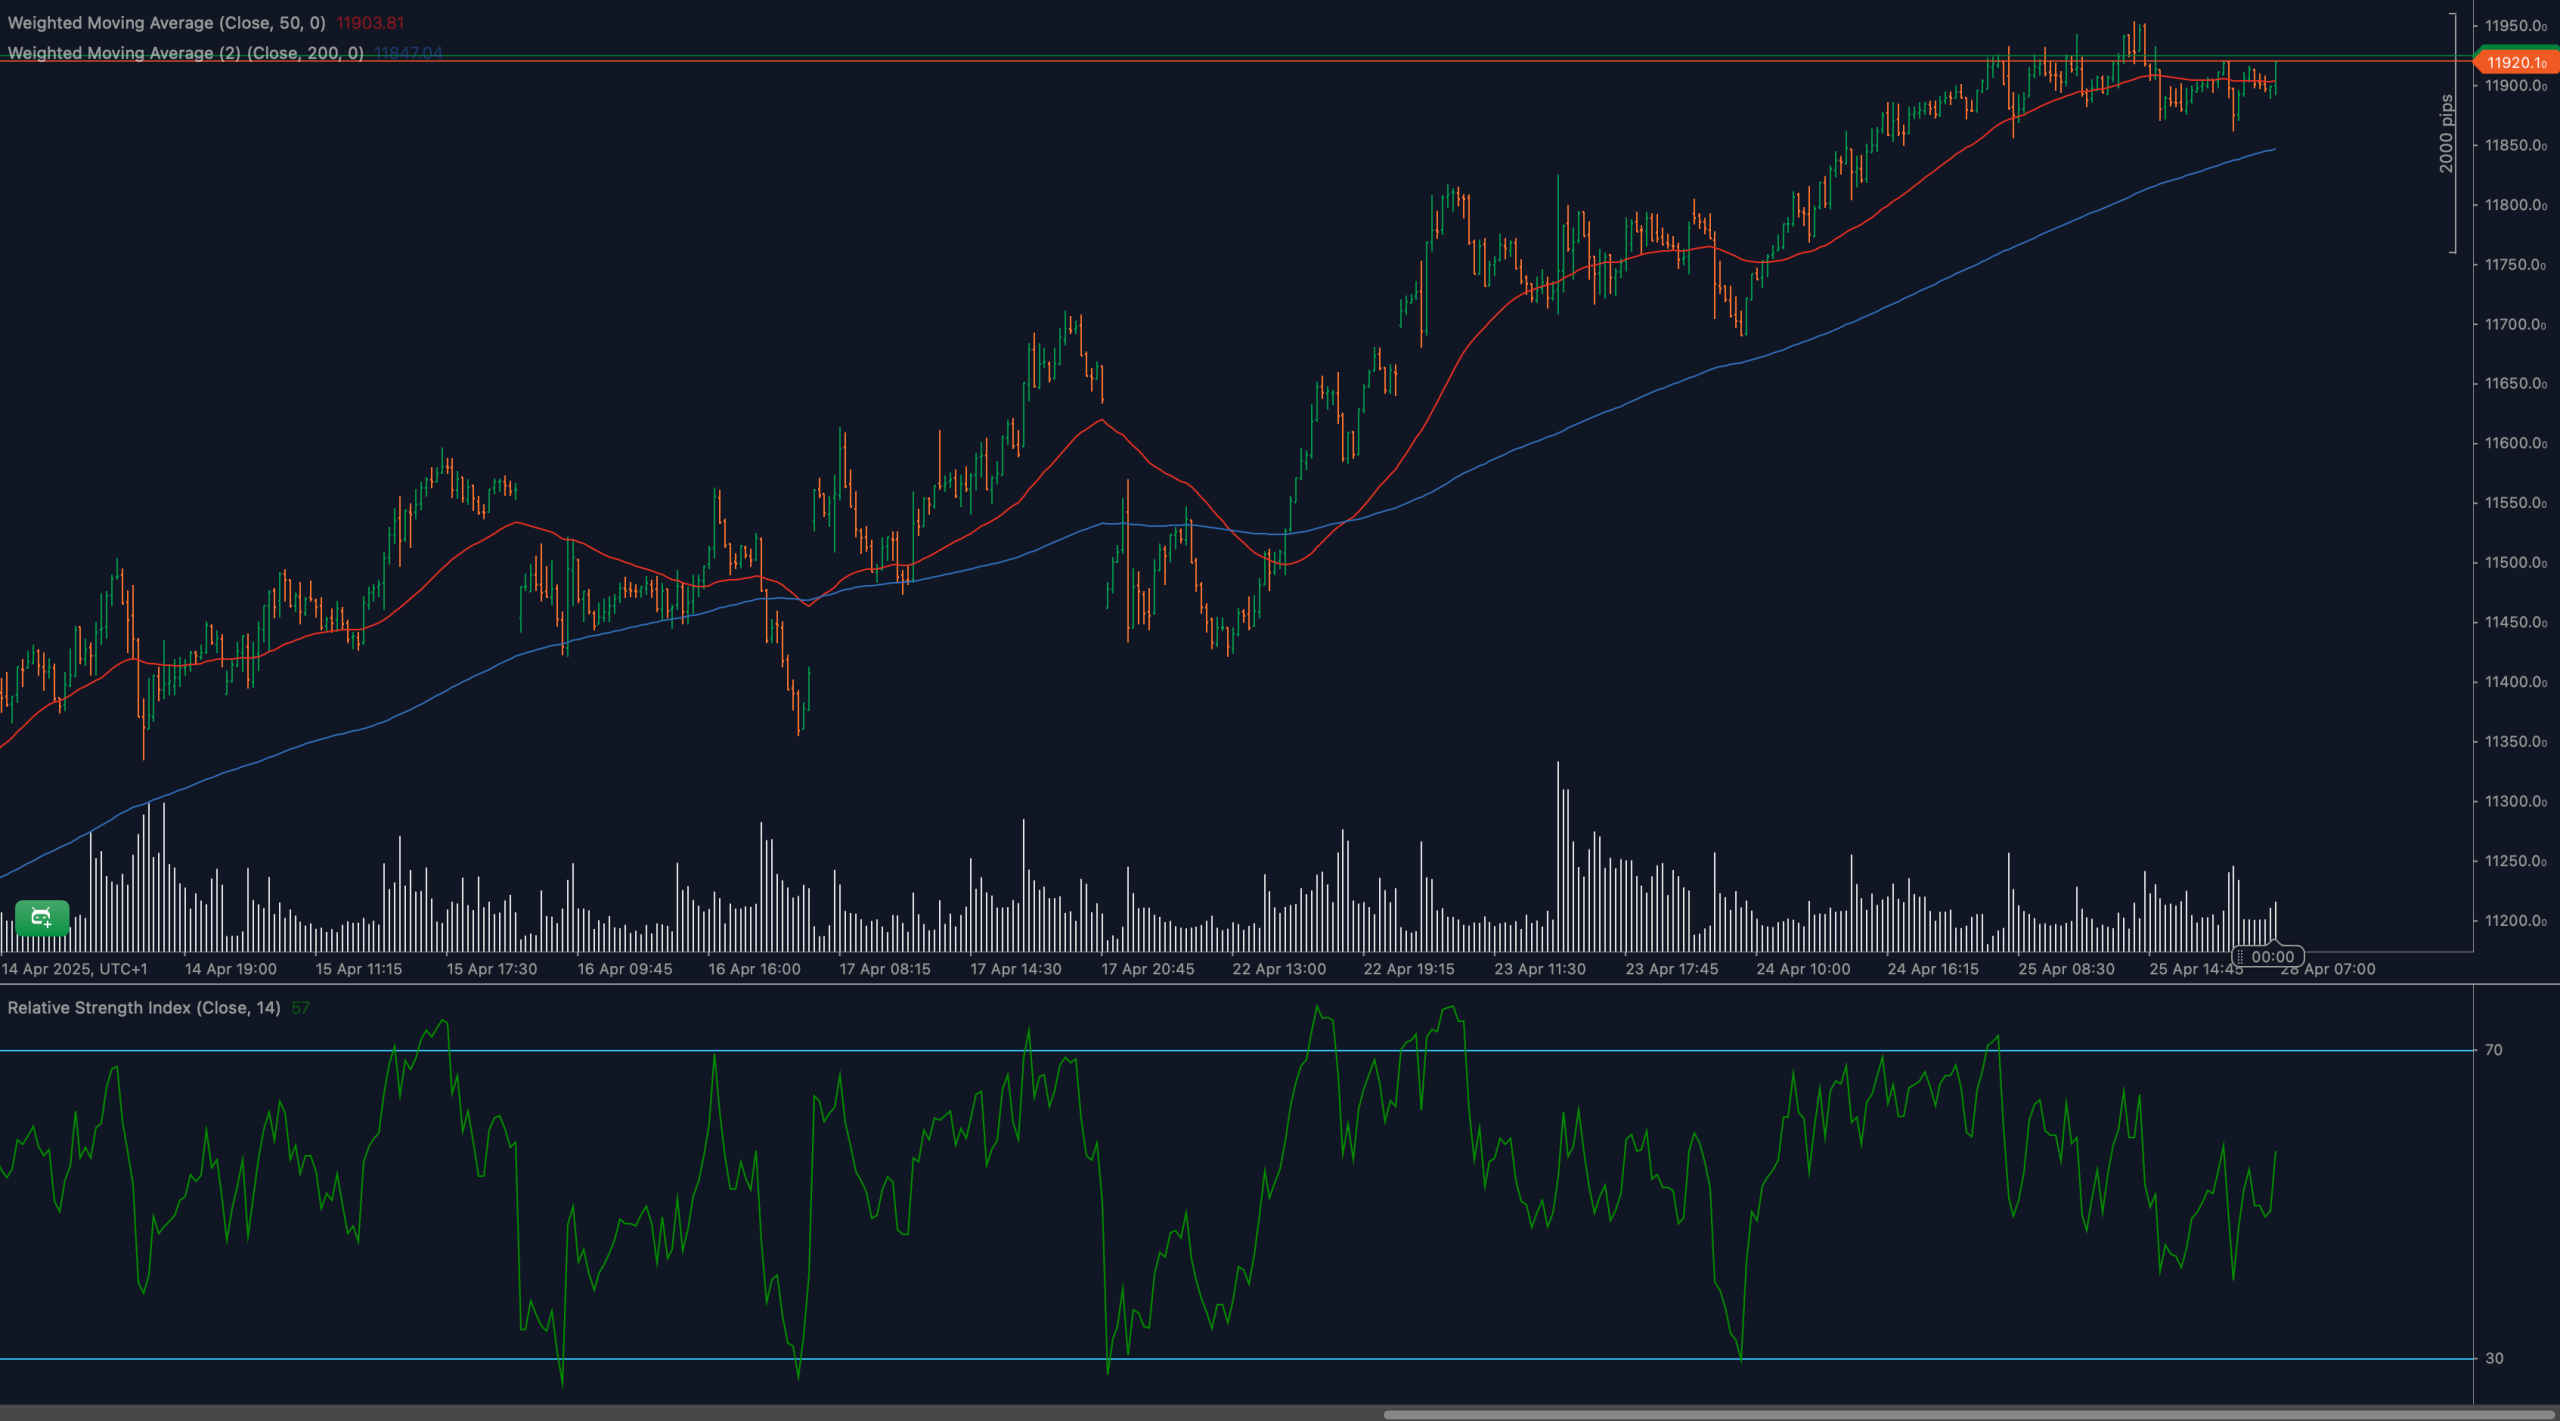
Resistance remains firm at 11,920, a psychological and technical ceiling. A confirmed breakout could open targets at 12,000 and 12,150. Immediate support lies around 11,800, aligned with minor structure and the 50-period WMA. Below that, stronger support can be found near 11,650, close to the 200-period WMA.
Moving Average Analysis and Dynamic Price Levels
The 50-period WMA (11,903) continues to slope gently upward and sits just below current price action, providing dynamic support. The 200-period WMA (11,827) trends lower but is starting to flatten, reinforcing longer-term trend strength. The bullish structure remains intact as long as price stays above these averages.
RSI Momentum Analysis and Divergence Patterns
The 14-period RSI currently sits at 57, reflecting neutral-to-slightly-bullish conditions. RSI has cooled from prior overbought readings but remains above the critical 50 line. There is no clear bullish or bearish divergence, indicating consolidation rather than reversal — but loss of 50 support would signal weakening momentum.
Price Action and Candlestick Analysis
Recent candles show reduced range and multiple doji-like formations, classic signals of market indecision. Price has consistently rejected higher pushes near 11,920, while pullbacks have been shallow, showing a balance between buyers and sellers. A decisive candle close above resistance or below 11,800 will likely determine the next breakout or breakdown.
Chart Patterns and Formation Analysis
SMI20 appears to be forming a flat consolidation or rectangle pattern just beneath resistance. This type of setup often precedes a continuation move when occurring after a rally, but without confirmation, false breakouts are possible. A sustained close above 11,920 would confirm the pattern’s bullish resolution.
Fibonacci Retracement Levels and Extension Targets
Drawing from the rally low around 11,520 to the current high near 11,920, the 23.6% retracement rests at 11,820, aligning with dynamic moving average support. The 38.2% retracement sits around 11,750. Fibonacci extensions project potential targets at 12,000 (127.2%) and 12,150 (161.8%) if the breakout occurs.
🔍 MARKET OUTLOOK & TRADING SCENARIOS
Bullish Scenario for SMI20
A breakout above 11,920, confirmed by volume and bullish candles, would likely trigger a continuation move toward 12,000 and 12,150. RSI would need to push toward 65–70 to confirm renewed buying strength. Traders could look for entries on strong closes above the resistance zone.
Neutral Scenario for SMI20
If price remains trapped between 11,800–11,920, consolidation continues. Range-bound strategies favor quick scalps near support and resistance boundaries, with tight risk controls. RSI hovering between 50–60 would validate a neutral bias.
Bearish Scenario for SMI20
A break below 11,800, particularly on rising bearish volume, would invalidate the bullish setup. This would expose downside risk toward 11,650 and the 200-WMA. A falling RSI below 50 would confirm weakening momentum and favor short setups.
💼 TRADING CONSIDERATIONS
Bullish traders should wait for a breakout above 11,920, ideally accompanied by increasing volume and an RSI move toward 65. Long targets include 12,000 and 12,150, with stops beneath 11,850 to manage risk.
Bearish traders could look for failures at resistance and breakdowns below 11,800 to open shorts toward 11,650. Risk management remains crucial, especially given the tight consolidation and the potential for false breakouts.
🏁 CONCLUSION
SMI20 is consolidating beneath a critical resistance level at 11,920. While the broader trend remains bullish, indecision dominates near this ceiling. Traders should closely monitor for breakout confirmation or breakdown warnings, as the next move could offer significant opportunities depending on direction.
⚠️ DISCLAIMER
This analysis is provided for educational purposes only and does not constitute financial advice. Trading involves risk, and you should consult a licensed professional before making any trading decisions.


