
Technical Analysis: Sideways Action with Breakout Potential
- Moving Averages Confirm Indecision:
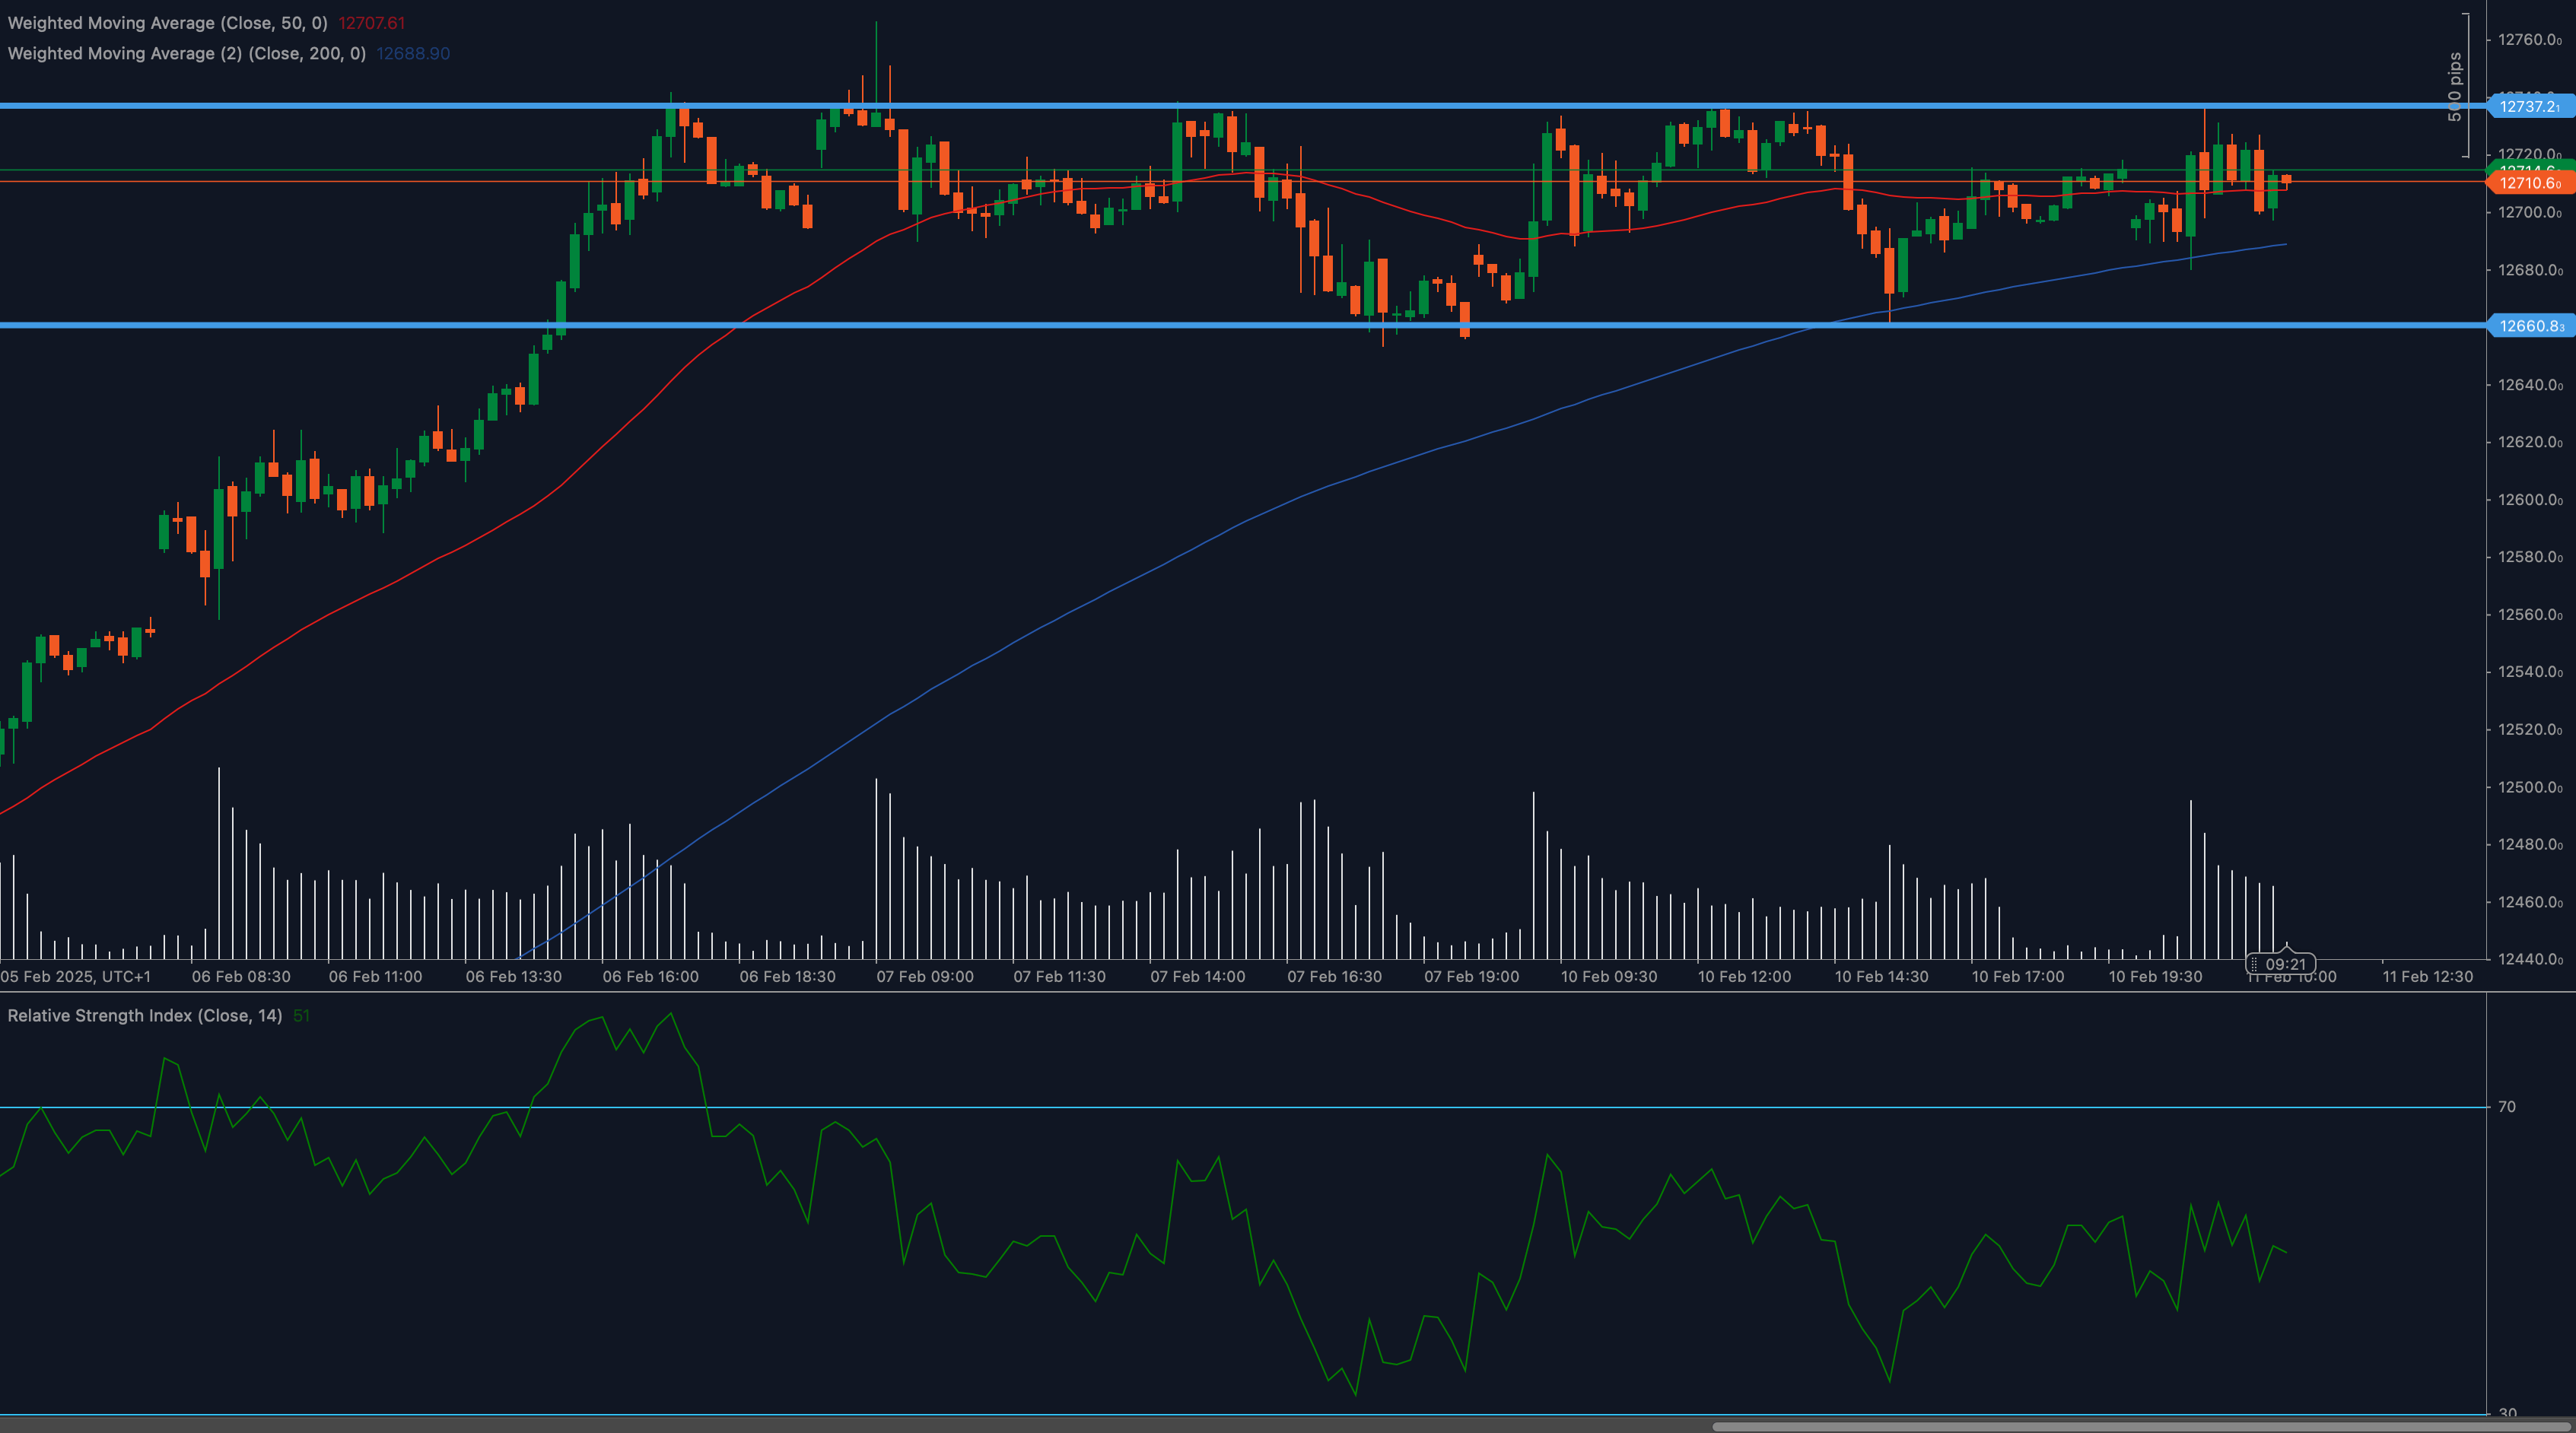
- The 50-period Weighted Moving Average (WMA), currently around 12,707, is closely tracking price action, indicating a lack of strong directional bias.
- The 200-period WMA, sitting near 12,688, provides underlying support, but its distance from the current price highlights the short-term sideways movement.
- RSI Reflects Balanced Momentum: The Relative Strength Index (RSI) is hovering around 51, a neutral reading that suggests neither bulls nor bears have firm control. A rise above 55 could signal increasing bullish momentum, while a drop below 45 would likely indicate strengthening selling pressure.
- Candlestick Patterns Suggest Potential Bearish Undertones: While the overall picture is one of consolidation, specific candlestick patterns observed in early February 2025 trading suggest potential bearish pressure. Patterns like “Doji” formations (indicating indecision) and a “Dark Cloud Cover” (a bearish reversal pattern) have been present. The potential for an emerging “Harami Bearish” pattern should also be noted. It is important to note, though, that these should be observed along with other indicators.
- Volume: Volume has been relatively consistent, with no significant spikes to signal strong conviction behind any particular move within the consolidation range.
Key Support and Resistance Levels
The IBEX 35 is currently in a consolidation phase, making these levels crucial for identifying potential breakout opportunities:
- Support Levels:
- 12,660: This is the immediate and most important support level, representing the lower boundary of the current trading range.
- 12,600: A deeper support level that could come into play if selling pressure intensifies significantly.
- Resistance Levels:
- 12,737: The immediate resistance level, capping any upward movement within the current range.
- 12,780: The next key resistance level to watch if a bullish breakout occurs.
Fundamental Factors Influencing the IBEX 35
Beyond the technical picture, several fundamental factors are likely to play a crucial role in determining the direction of the next move:
- European Market Sentiment: The IBEX 35 is highly correlated with broader European stock market trends. Positive or negative sentiment in other major European indices (DAX, CAC 40) will influence the ES35.
- ECB Monetary Policy: The European Central Bank’s (ECB) decisions regarding interest rates and quantitative easing are paramount. Any hints of a more hawkish stance (tightening policy) could pressure the IBEX 35, while a dovish outlook (loosening policy) could provide support. Upcoming ECB meetings and speeches should be closely monitored.
- Spanish and Eurozone Economic Data: Key economic data releases from Spain and the broader Eurozone will be crucial. These include:
- GDP Growth: For both Spain and the Eurozone.
- Unemployment Rates: Particularly important for Spain, which has historically faced high unemployment.
- Inflation (CPI): Rising inflation could prompt the ECB to tighten policy.
- Industrial Production and Retail Sales: Indicators of economic activity.
- Corporate Earnings: The IBEX 35 is heavily influenced by the performance of its major constituents, particularly:
- Banks: Banco Santander (SAN) and BBVA (BBVA) have a significant weighting.
- Utilities: Iberdrola (IBE) is a key player.
- Telecommunications: Telefonica (TEF) is a major component.
- Industrials: Inditex (ITX), the parent company of Zara, is also influential.
- Spanish Political Situation: While not always the primary driver, political stability and government policies in Spain can impact investor confidence.
Outlook and Potential Trading Strategies
The current outlook for the IBEX 35 is neutral in the short term, pending a breakout from the consolidation range. Here are some potential scenarios and (very generally) associated strategies:
- Bullish Breakout: A confirmed break above 12,737, ideally with increased volume and an RSI moving above 55, could signal a continuation of the previous (weakening) uptrend, targeting 12,780. Traders might consider long positions with appropriate risk management (e.g., stop-loss orders below the breakout level).
- Bearish Breakdown: A decisive break below 12,660, accompanied by increased volume and an RSI falling below 45, would suggest a potential trend reversal and could open the door for a test of 12,600. Traders might consider short positions with strict risk management (e.g., stop-loss orders above the breakdown level).
- Continued Consolidation: If the price remains within the 12,660-12,737 range, range-bound trading strategies might be considered, but with caution due to the potential for false breakouts.


