
📊 MARKET OVERVIEW
The Hang Seng Index (HSI50) has made a notable recovery over the past week but is now encountering stiff resistance near the 21,445 zone. This level coincides with recent price highs and has capped upside advances since April 14. While the bullish trend remains technically intact, price has started to coil sideways with less conviction, suggesting the rally may be losing steam.
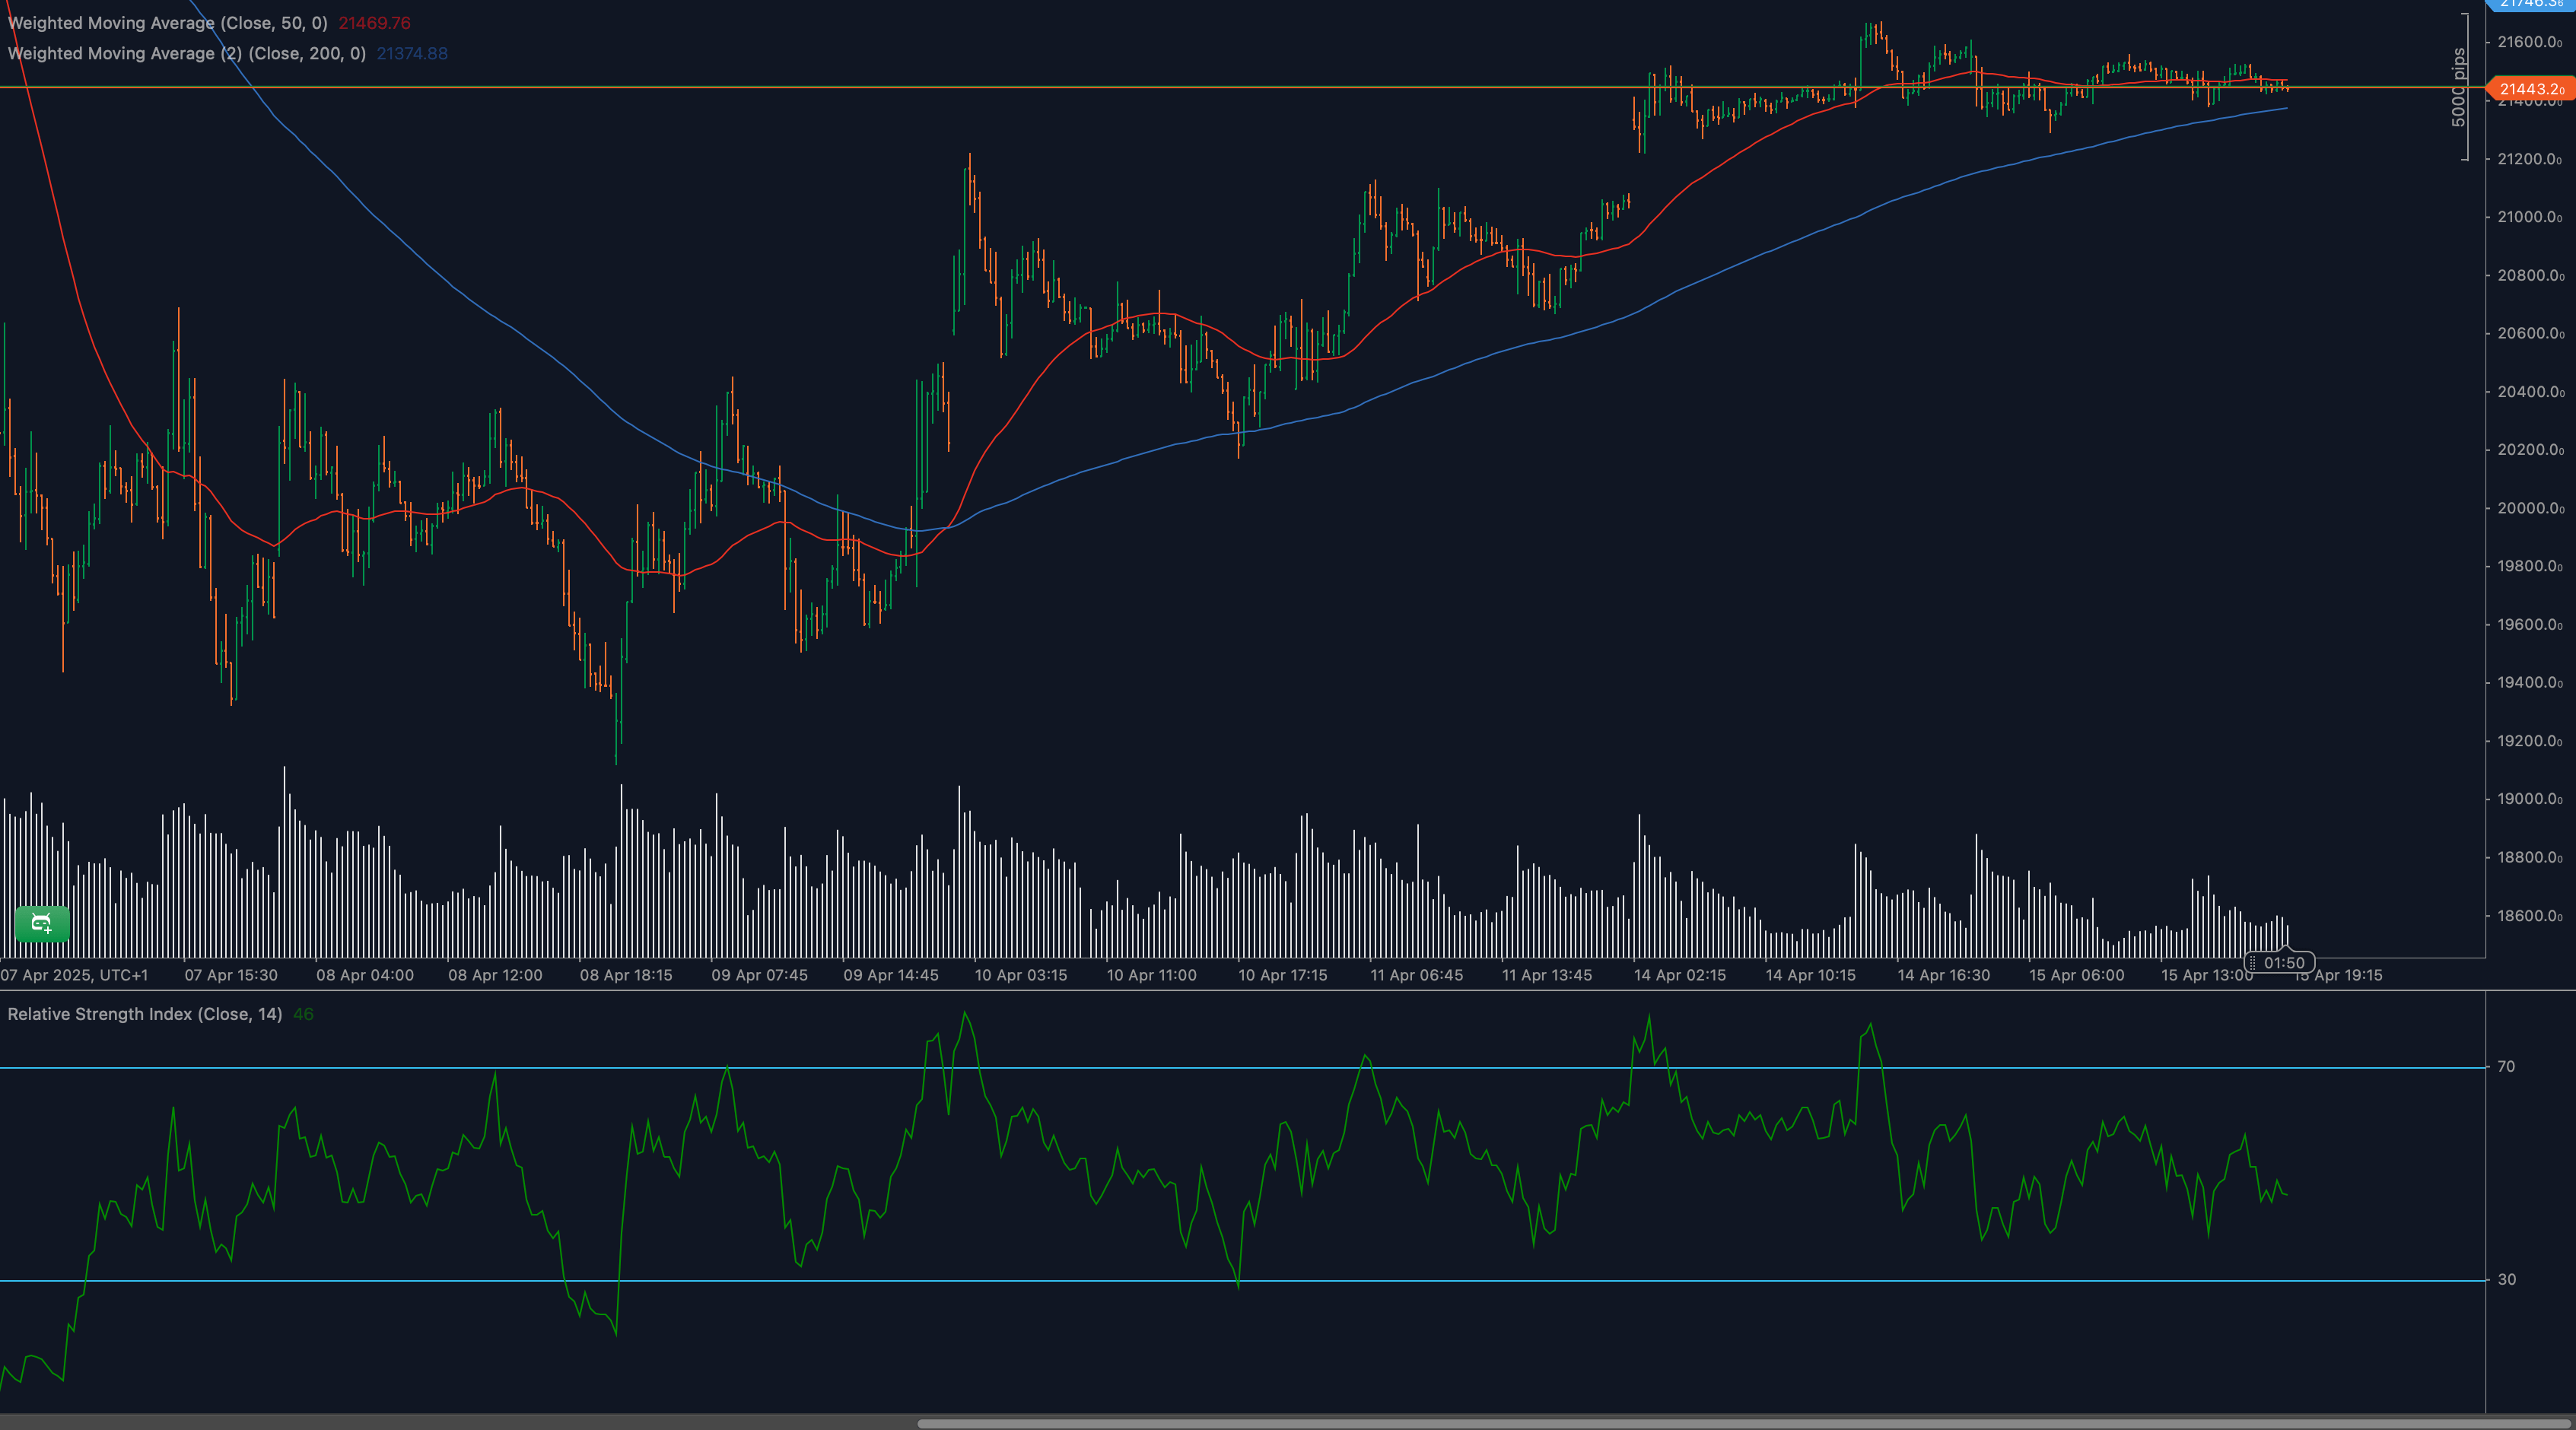
This consolidation phase is occurring with RSI flattening near neutral levels and volume tapering off. Traders are likely waiting on further directional cues before committing, making this a crucial moment to evaluate key support, resistance, and momentum signals as potential catalysts develop.
📈 TECHNICAL ANALYSIS
What Are the Key Support and Resistance Levels for HSI50?
Immediate resistance is found at 21,445 — a level tested repeatedly since April 14 but never closed above with strength. A confirmed breakout above this level could pave the way for a push toward 21,600 and potentially 21,850. On the downside, initial support lies around 21,250, with the 21,000 level offering a more significant base should the market break lower. A move below 20,850 would suggest trend fatigue and signal a potential bearish reversal.
Moving Average Analysis and Dynamic Price Levels
Price is currently resting just above both the 50-period WMA at 21,458 and the 200-period WMA at 21,374. These averages have aligned in a bullish structure, with the shorter-term moving average trending higher. The 200-WMA is also rising, lending additional strength to the support zone around 21,300. However, price has now stalled between these averages and resistance, compressing the range and hinting at a breakout setup.
RSI Momentum Analysis and Divergence Patterns
The 14-period RSI is currently hovering around 46, reflecting neutral momentum. After peaking near 68 earlier in the rally, RSI has gradually drifted lower in parallel with sideways price action. No clear divergence is present yet, but the absence of bullish acceleration suggests buyers are stepping back. A rebound in RSI above 55 would be a bullish momentum signal, while a drop below 40 may confirm waning strength.
Price Action and Candlestick Analysis
Recent candlesticks near resistance have been small and mixed in sentiment, with long wicks and short bodies showing indecision. While the structure does not yet show a full reversal, the lack of strong bullish closes at resistance is a cautionary sign. A clean bullish engulfing candle above 21,445 could trigger breakout confirmation, while a strong bearish rejection could push price back toward support levels quickly.
Chart Patterns and Formation Analysis
HSI50 appears to be forming a short-term ascending triangle, with a flat top at 21,445 and higher lows compressing from below. This is typically a bullish pattern that resolves with a breakout. However, if the market fails to hold the higher lows and breaks below 21,250, the pattern may collapse into a descending consolidation or a topping formation.
Fibonacci Retracement Levels and Extension Targets
Measuring from the April 8 swing low near 19,900 to the 21,445 high, the 23.6% Fibonacci retracement lies near 21,050, which aligns closely with structural support. The 38.2% level at 20,750 is the next key downside target on a failed breakout. On the upside, Fibonacci extension levels project 21,600 (127.2%) and 21,850 (161.8%) as the next rally targets if bulls regain control.
🔍 MARKET OUTLOOK & TRADING SCENARIOS
Bullish Scenario for HSI50
A bullish continuation would require a decisive breakout above 21,445, supported by RSI strength and volume expansion. If confirmed, price could move toward 21,600 initially and extend to 21,850. A close above 21,445 with follow-through would be a key trigger to validate this outlook.
Neutral Scenario for HSI50
The index may remain range-bound between 21,250 and 21,445 if no catalyst emerges. This sideways movement would favor short-term scalping or breakout prep strategies. RSI holding between 45–55 and price sitting between moving averages would support this thesis until a decisive break occurs.
Bearish Scenario for HSI50
If price is rejected at 21,445 again and breaks below 21,250 with increasing momentum, the index could start a corrective phase. This would expose downside toward 21,000 and 20,750. RSI dropping below 40 and bearish candles forming beneath the 50-WMA would confirm bearish momentum.
💼 TRADING CONSIDERATIONS
Traders should watch closely for confirmation candles at the 21,445 resistance zone. Long entries above that level should be backed by volume, RSI strength, and preferably a clean engulfing or breakout candle. Targets may be set at 21,600 and 21,850 with stop-losses near 21,250 to minimize risk.
Short opportunities may emerge on failed breakout attempts or rejections from resistance. In that case, ideal entry would be below 21,250 with confirmation from RSI slipping lower and price losing the 50-WMA. A gradual trailing stop strategy can protect profits if the move extends toward 21,000 or below.
🏁 CONCLUSION
HSI50 is consolidating under the 21,445 resistance with momentum showing signs of exhaustion. While the underlying trend remains supported by moving averages, the lack of bullish follow-through could hint at distribution. The upcoming sessions will be critical in confirming a breakout or the start of a correction. Traders should stay nimble and ready to act on confirmation signals backed by momentum and volume.
⚠️ DISCLAIMER
This analysis is intended for informational purposes only and does not constitute financial advice. Trading in leveraged markets involves substantial risk and may not be suitable for all investors. Always perform your own analysis and consult with a qualified financial advisor before taking trading decisions.


