
📊 MARKET OVERVIEW
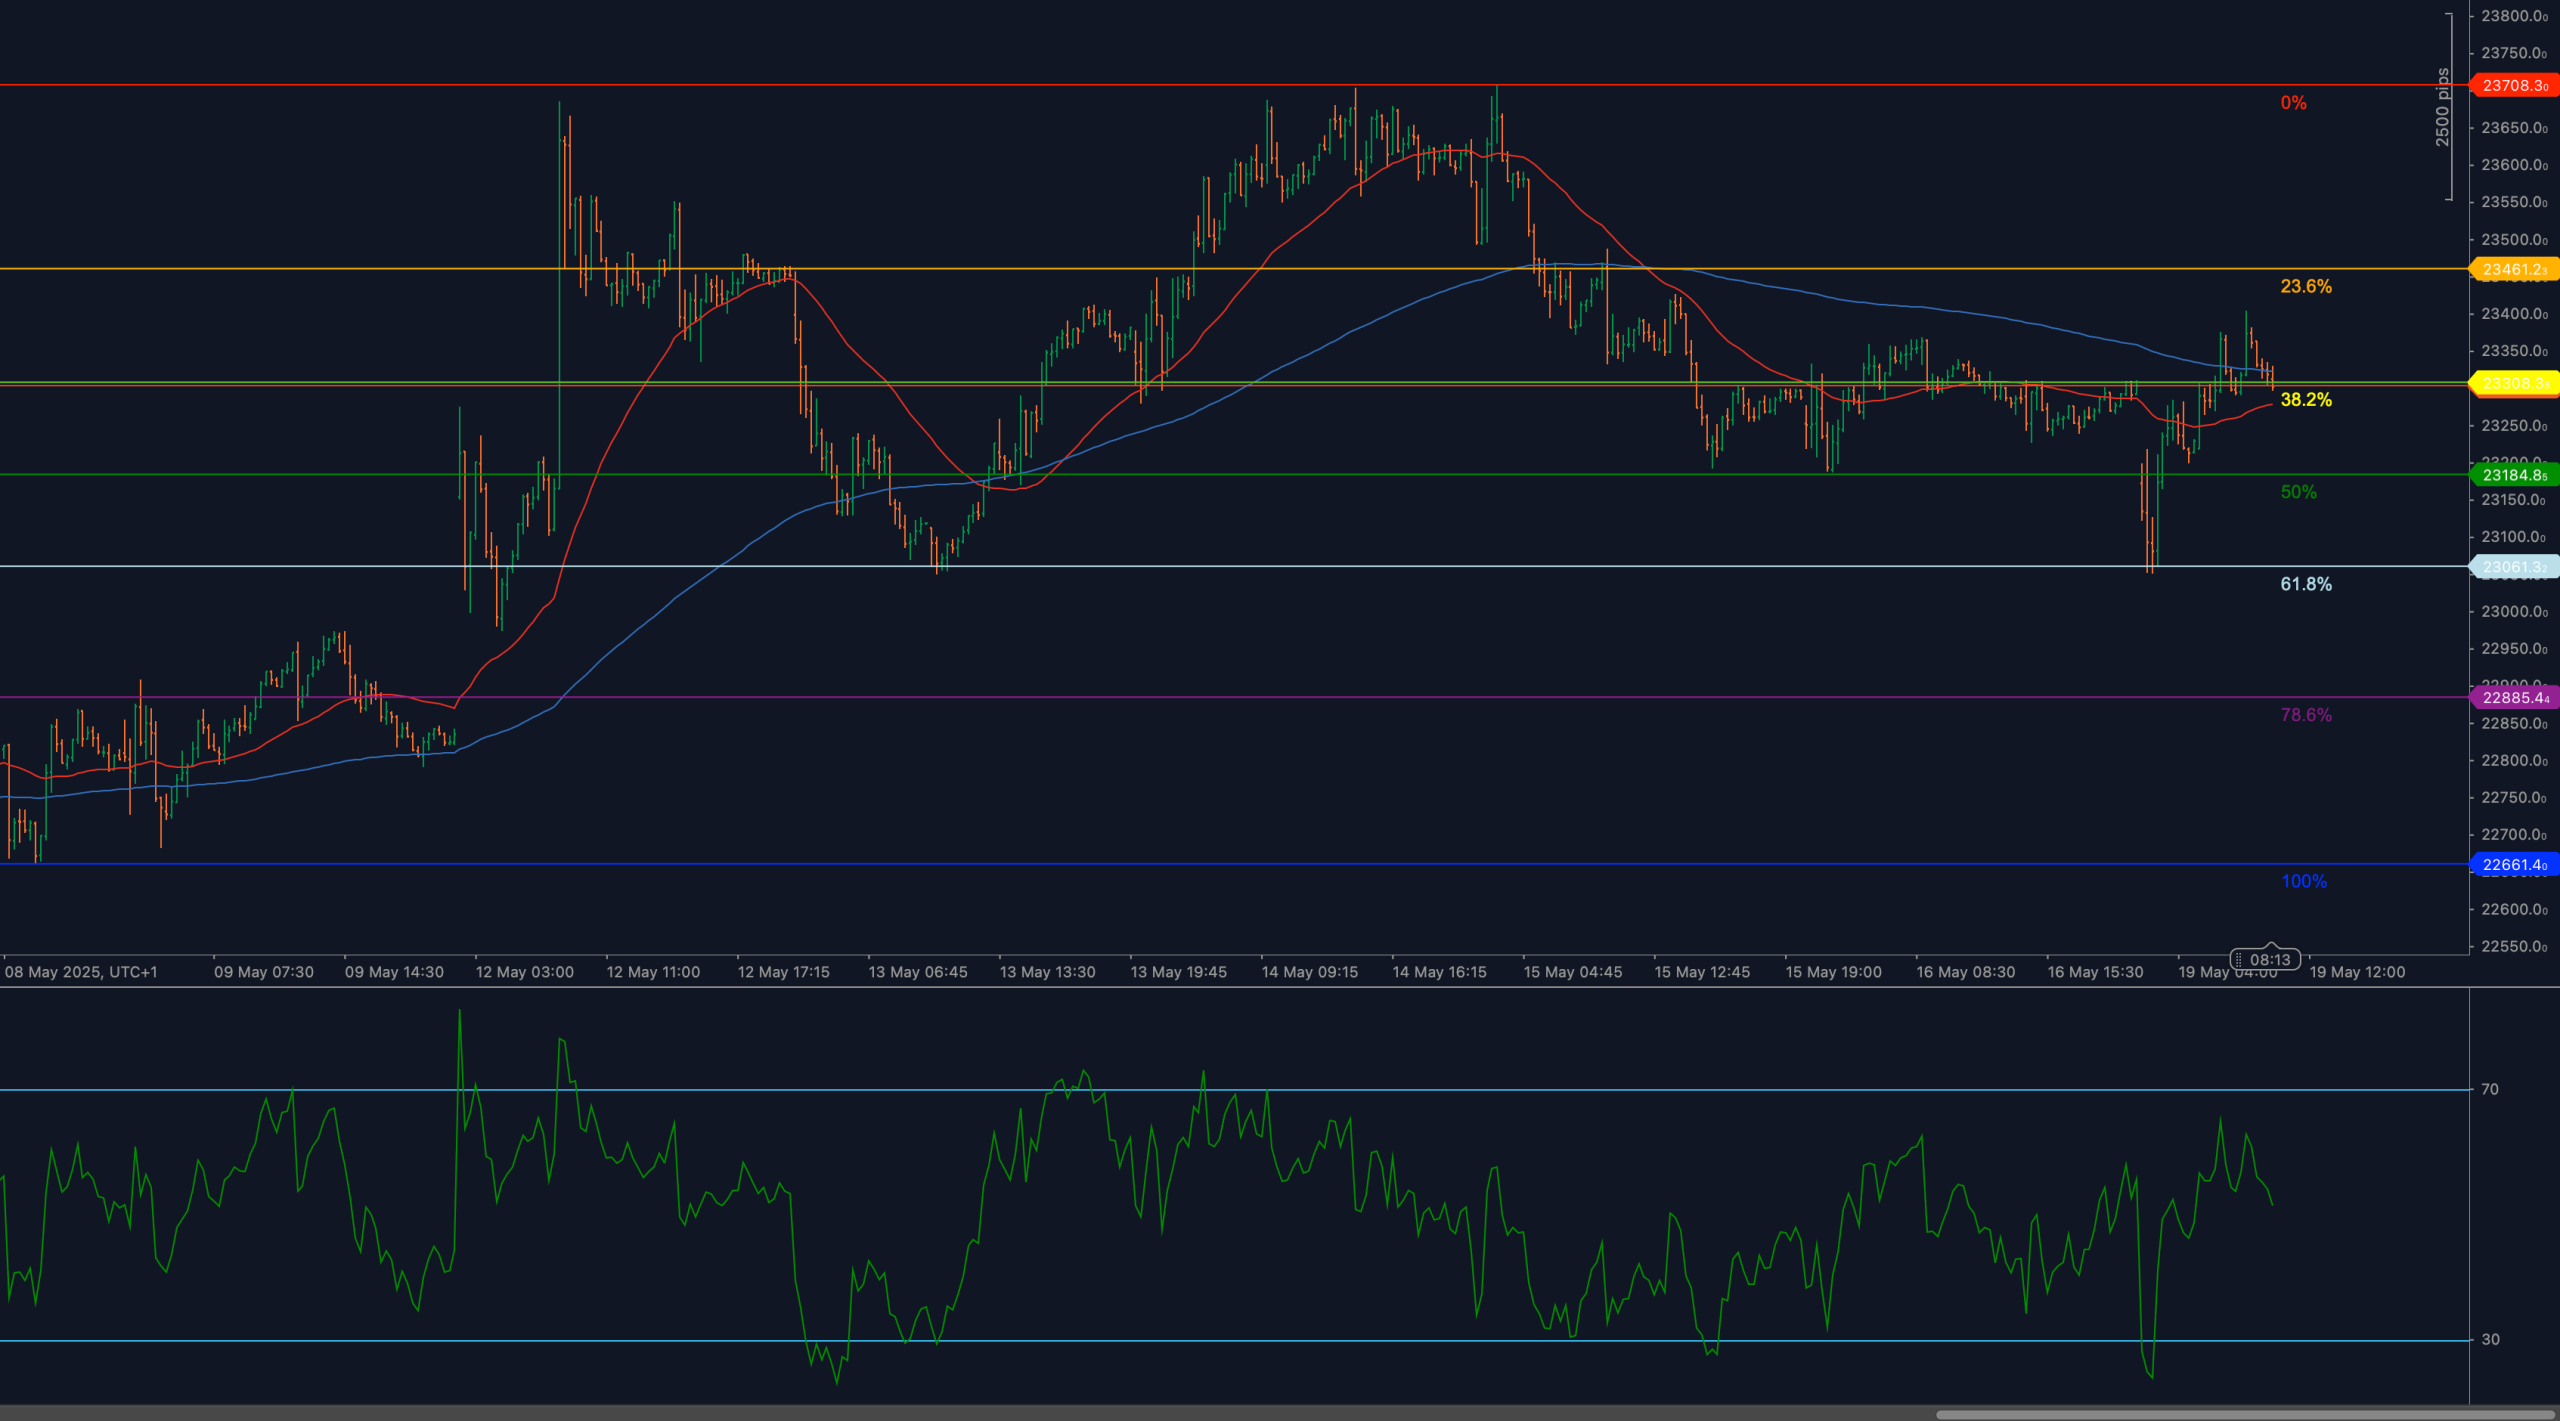
HSI50 staged a recovery from last week’s flash drop to 23,010, bouncing off deep support and reclaiming the 38.2% Fibonacci retracement at 23,506. However, the rebound has stalled below 23,661, where resistance from the 200-period weighted moving average and prior structure are capping price. The recent spike in volatility and soft macro risk appetite have contributed to cautious flows, limiting follow-through despite the technical bounce.
While the pair remains above key short-term support, the upside structure is incomplete. RSI has rolled off intraday highs, price is still below major trend resistance, and bears remain in position to regain control if 23,506 fails to hold. Bulls must clear 23,661 decisively to confirm trend continuation toward 23,784.
📈 TECHNICAL ANALYSIS
Key Support and Resistance Levels
The immediate resistance is located at 23,661, aligning with a prior structural pivot and the 200-WMA. A clean break above this level would open the path to 23,784, the 23.6% Fibonacci retracement, and ultimately 23,870, the full rally high.
To the downside, support rests first at 23,506, the 38.2% retracement of the May rebound. A confirmed move below this level would target 23,184, the 50% retracement, followed by the 61.8% level at 23,010, which held on the last flush and remains the primary support for the broader move. A break here would expose full retracement to 22,661.
Moving Averages and Dynamic Price Action
Price is currently sandwiched between the 50-WMA and 200-WMA, with the 200-WMA acting as active resistance at 23,661. The 50-WMA has turned upward, supporting the short-term trend near 23,400, and may serve as a pivot for momentum shifts.
Until price clears the 200-WMA and establishes a higher high, moving average structure remains neutral-bearish. If the 50-WMA fails to hold, short-term trend pressure could resume to the downside.
RSI Momentum and Bearish Pressure
The 14-period RSI climbed sharply during the rebound but has now rolled off highs near 62 and is currently consolidating around 54. This reversal from the upper band confirms a loss of bullish momentum. A failure to break back above 60–65 would likely coincide with price rolling back below 23,506 and possibly retesting deeper supports.
A break below 50 in RSI would confirm bearish shift and support a move toward the 23,184–23,010 zone. Bulls must reclaim 60+ to validate further upside.
Candlestick Behavior and Price Action Clarity
Recent candlesticks show upper wicks and lower closes near 23,661, reflecting rejection at trend resistance. This candle structure aligns with waning RSI and narrowing body size — a sign of reduced conviction. Unless price produces a strong bullish engulfing close above 23,661, continuation appears unlikely in the short term.
Price remains within a rebound leg but without confirmation. Bulls need to print a clean breakout candle above resistance with follow-through.
Chart Structure and Breakdown Formation
The current chart structure is corrective, following a deep flush to 23,010 and a technical rebound. Price has recovered into Fibonacci territory, but has failed to reclaim trend control above 23,661. This creates the risk of a right shoulderor bearish rollover, especially if RSI continues to weaken.
The move resembles a retracement leg rather than a trend continuation. A failure at 23,506 would confirm a rounded top and shift focus back to the full retracement path.
Fibonacci Retracement and Extension Levels
The Fibonacci retracement drawn from 22,661 (May 8 low) to 23,870 (May 13 high) outlines the current pullback structure. Price briefly broke 50% at 23,184 before recovering and stabilizing above the 38.2% retracement at 23,506.
To the upside, the next level is 23,661, followed by the 23.6% retracement at 23,784, which aligns with structural congestion. A break above that would target full retracement at 23,870, and potentially Fibonacci extensions toward 24,000+.
To the downside, loss of 23,506 reopens 23,184 and then 23,010, the 61.8% retracement. A break here would reestablish bearish control and bring 22,886 and 22,661 back into focus.
🔍 MARKET OUTLOOK & TRADING SCENARIOS
Bullish Scenario
A break and close above 23,661, confirmed with RSI pushing back through 60, would confirm bullish reengagement. Upside targets would include 23,784, then 23,870. Volume expansion would support continuation.
Neutral Scenario
Price holds between 23,506 and 23,661, while RSI drifts between 50–55, suggesting equilibrium. This would indicate indecision and consolidation ahead of a potential breakout or rejection.
Bearish Scenario
A breakdown below 23,506, especially with RSI below 50, would reactivate bearish targets at 23,184, 23,010, and possibly full retracement to 22,661. Momentum would favor continuation lower.
💼 TRADING CONSIDERATIONS
Short setups remain favored below 23,661 on rejection signals, targeting 23,184 and 23,010. Bullish entries require breakout confirmation above 23,661 with RSI >60. Neutral positioning valid within current range; confirmation needed to enter.
🏁 CONCLUSION
HSI50 has reclaimed the 38.2% Fibonacci level at 23,506 but remains capped below 23,661 and the 200-WMA. RSI is rolling over, price action shows hesitation, and structure reflects a vulnerable rebound. Unless bulls break through 23,661, downside targets at 23,184 and 23,010 remain active.
⚠️ DISCLAIMER
This analysis is for informational purposes only and does not constitute financial advice. Always consult with a licensed financial professional before making trading decisions.


