
📊 MARKET OVERVIEW
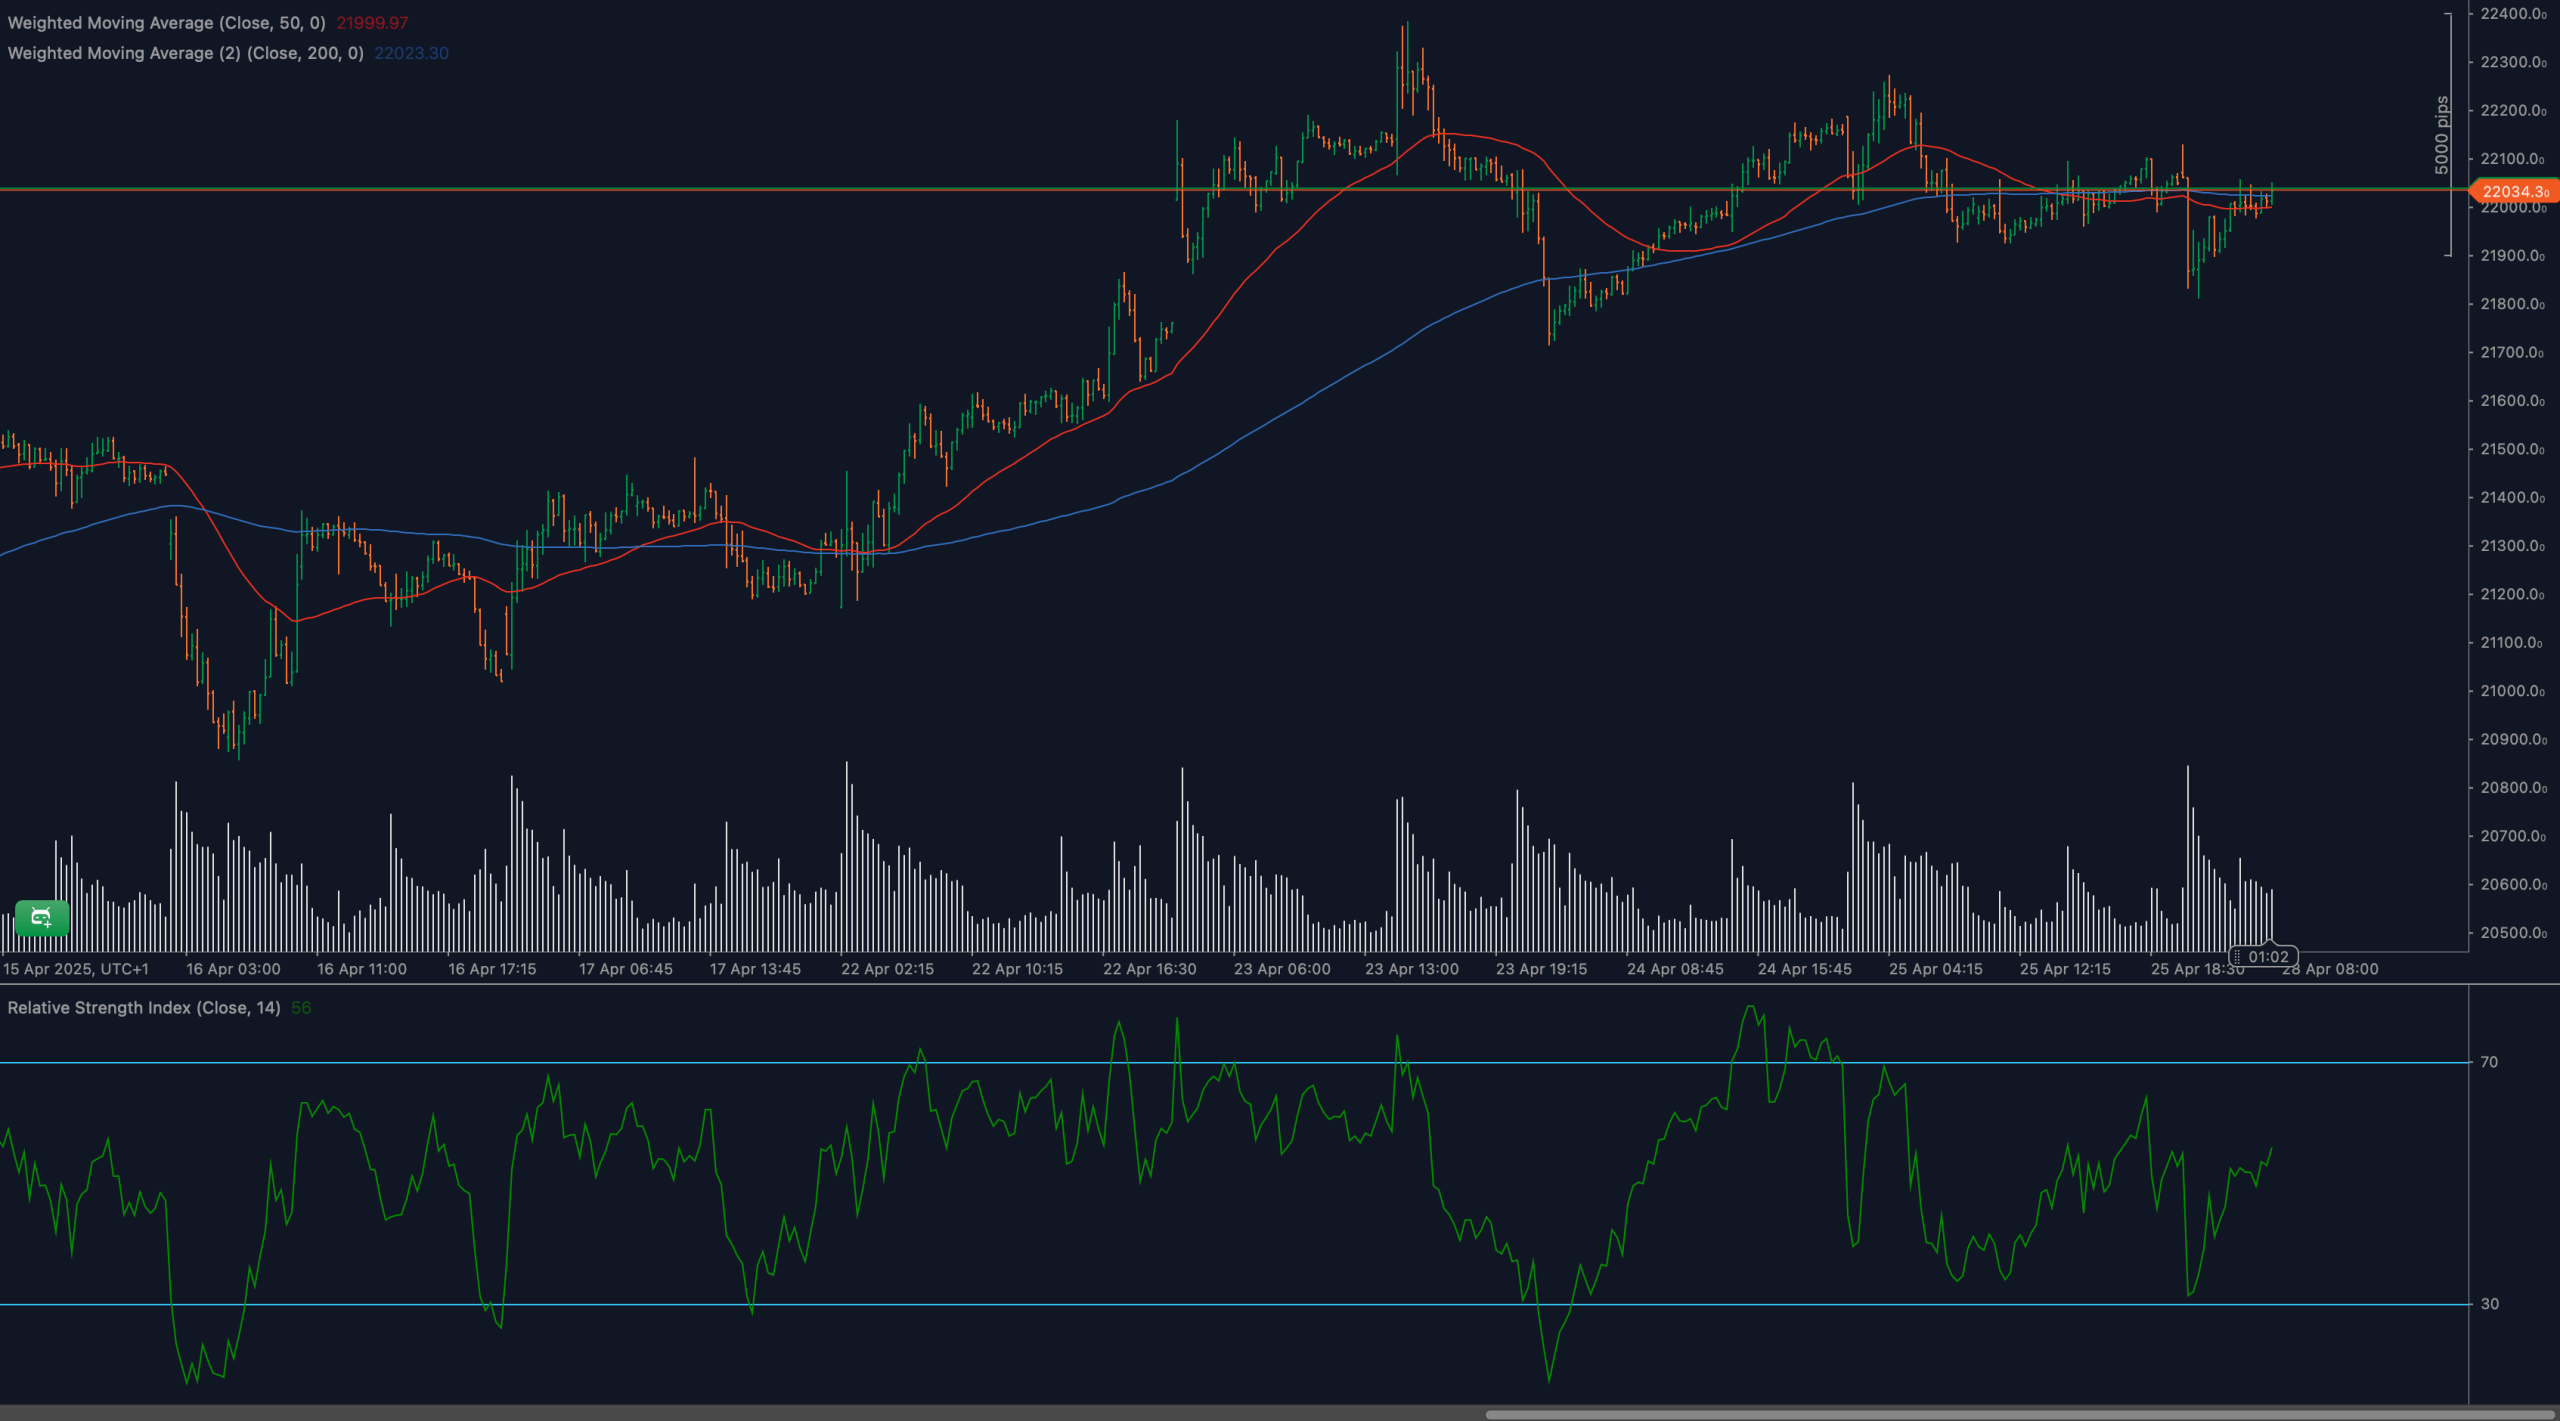
HSI50 (Hang Seng Index) has mounted a strong recovery from April’s swing lows, rising steadily to retest the critical 22,035 resistance level. After a prolonged downtrend earlier in the month, the recent stabilization suggests a shift toward range trading.
The index now trades above both its 50- and 200-period moving averages, a bullish structural development. However, volume remains moderate and RSI is hovering near neutral levels, suggesting the market is waiting for a catalyst before confirming a new directional breakout.
📈 TECHNICAL ANALYSIS
What Are the Key Support and Resistance Levels for HSI50?
Resistance is clearly defined at 22,035. A confirmed breakout could target 22,300 and potentially 22,500. Immediate support lies at 21,800, followed by stronger support around 21,500, near the 200-WMA. Losing 21,500 would expose the lower end of the range toward 21,000.
Moving Average Analysis and Dynamic Price Levels
Price has crossed back above the 50-period WMA (21,990) and the 200-period WMA (22,023), now using them as dynamic support. The 50-WMA is starting to curve upward, indicating an improving short-term trend. As long as price remains above these moving averages, the bulls have a structural advantage.
RSI Momentum Analysis and Divergence Patterns
The 14-period RSI stands at 56, recovering steadily from oversold conditions. The neutral reading reflects cautious optimism but lacks breakout momentum. No bullish or bearish divergence is currently visible. If RSI pushes toward 65–70, it would strengthen the bullish outlook. A fall back below 50 would favor bears.
Price Action and Candlestick Analysis
Recent candles show balanced buying and selling pressure with slightly bullish leanings. Multiple small-bodied candles and wick rejections near 22,035 suggest hesitation rather than rejection. A strong bullish candle closing above this resistance would confirm breakout intentions. Failure to close above could lead to another rejection and retest of lower supports.
Chart Patterns and Formation Analysis
HSI50 is forming a range-bound consolidation pattern, with defined boundaries at 21,500 and 22,035. Such patterns usually resolve with a breakout in the direction of the prior trend — in this case, the recovery bias suggests a bullish resolution unless key supports are broken.
Fibonacci Retracement Levels and Extension Targets
Applying retracement from the rally low at 21,000 to the 22,035 high, the 23.6% retracement rests near 21,800, aligning with initial support. The 38.2% retracement lies at 21,650. If price breaks above 22,035, Fibonacci extensions project upside targets near 22,300 (127.2%) and 22,500 (161.8%).
🔍 MARKET OUTLOOK & TRADING SCENARIOS
Bullish Scenario for HSI50
A confirmed breakout above 22,035, supported by bullish volume and RSI strength toward 65, would validate continuation toward 22,300 and 22,500. Traders could seek long entries above resistance, ideally on strong candle closes.
Neutral Scenario for HSI50
If price remains stuck between 21,800 and 22,035, range trading continues. RSI hovering between 50–60 would favor a sideways bias, ideal for range scalping strategies.
Bearish Scenario for HSI50
Failure to break 22,035 and a move back below 21,800 would suggest bearish pressure. If confirmed by RSI dipping below 50 and bearish candlestick patterns, the index could revisit 21,500 and possibly 21,000.
💼 TRADING CONSIDERATIONS
Bullish traders should await a confirmed breakout above 22,035 with volume support. Upside targets include 22,300and 22,500, with stops under 21,900 to protect against false breakouts.
Bearish setups would be considered on rejection from 22,035 and a breakdown below 21,800, targeting 21,500 and 21,000. Stops can be placed above 22,100 for risk management.
🏁 CONCLUSION
HSI50 is consolidating just beneath a major resistance level at 22,035. Although the trend has improved structurally, momentum has yet to fully support a bullish breakout. Traders should watch closely for confirmation of breakout continuation or renewed rejection leading back toward range lows.
⚠️ DISCLAIMER
This analysis is for informational purposes only and does not constitute financial advice. All trading involves risks. Please consult a licensed financial advisor before making any investment decisions.


