
📊 MARKET OVERVIEW
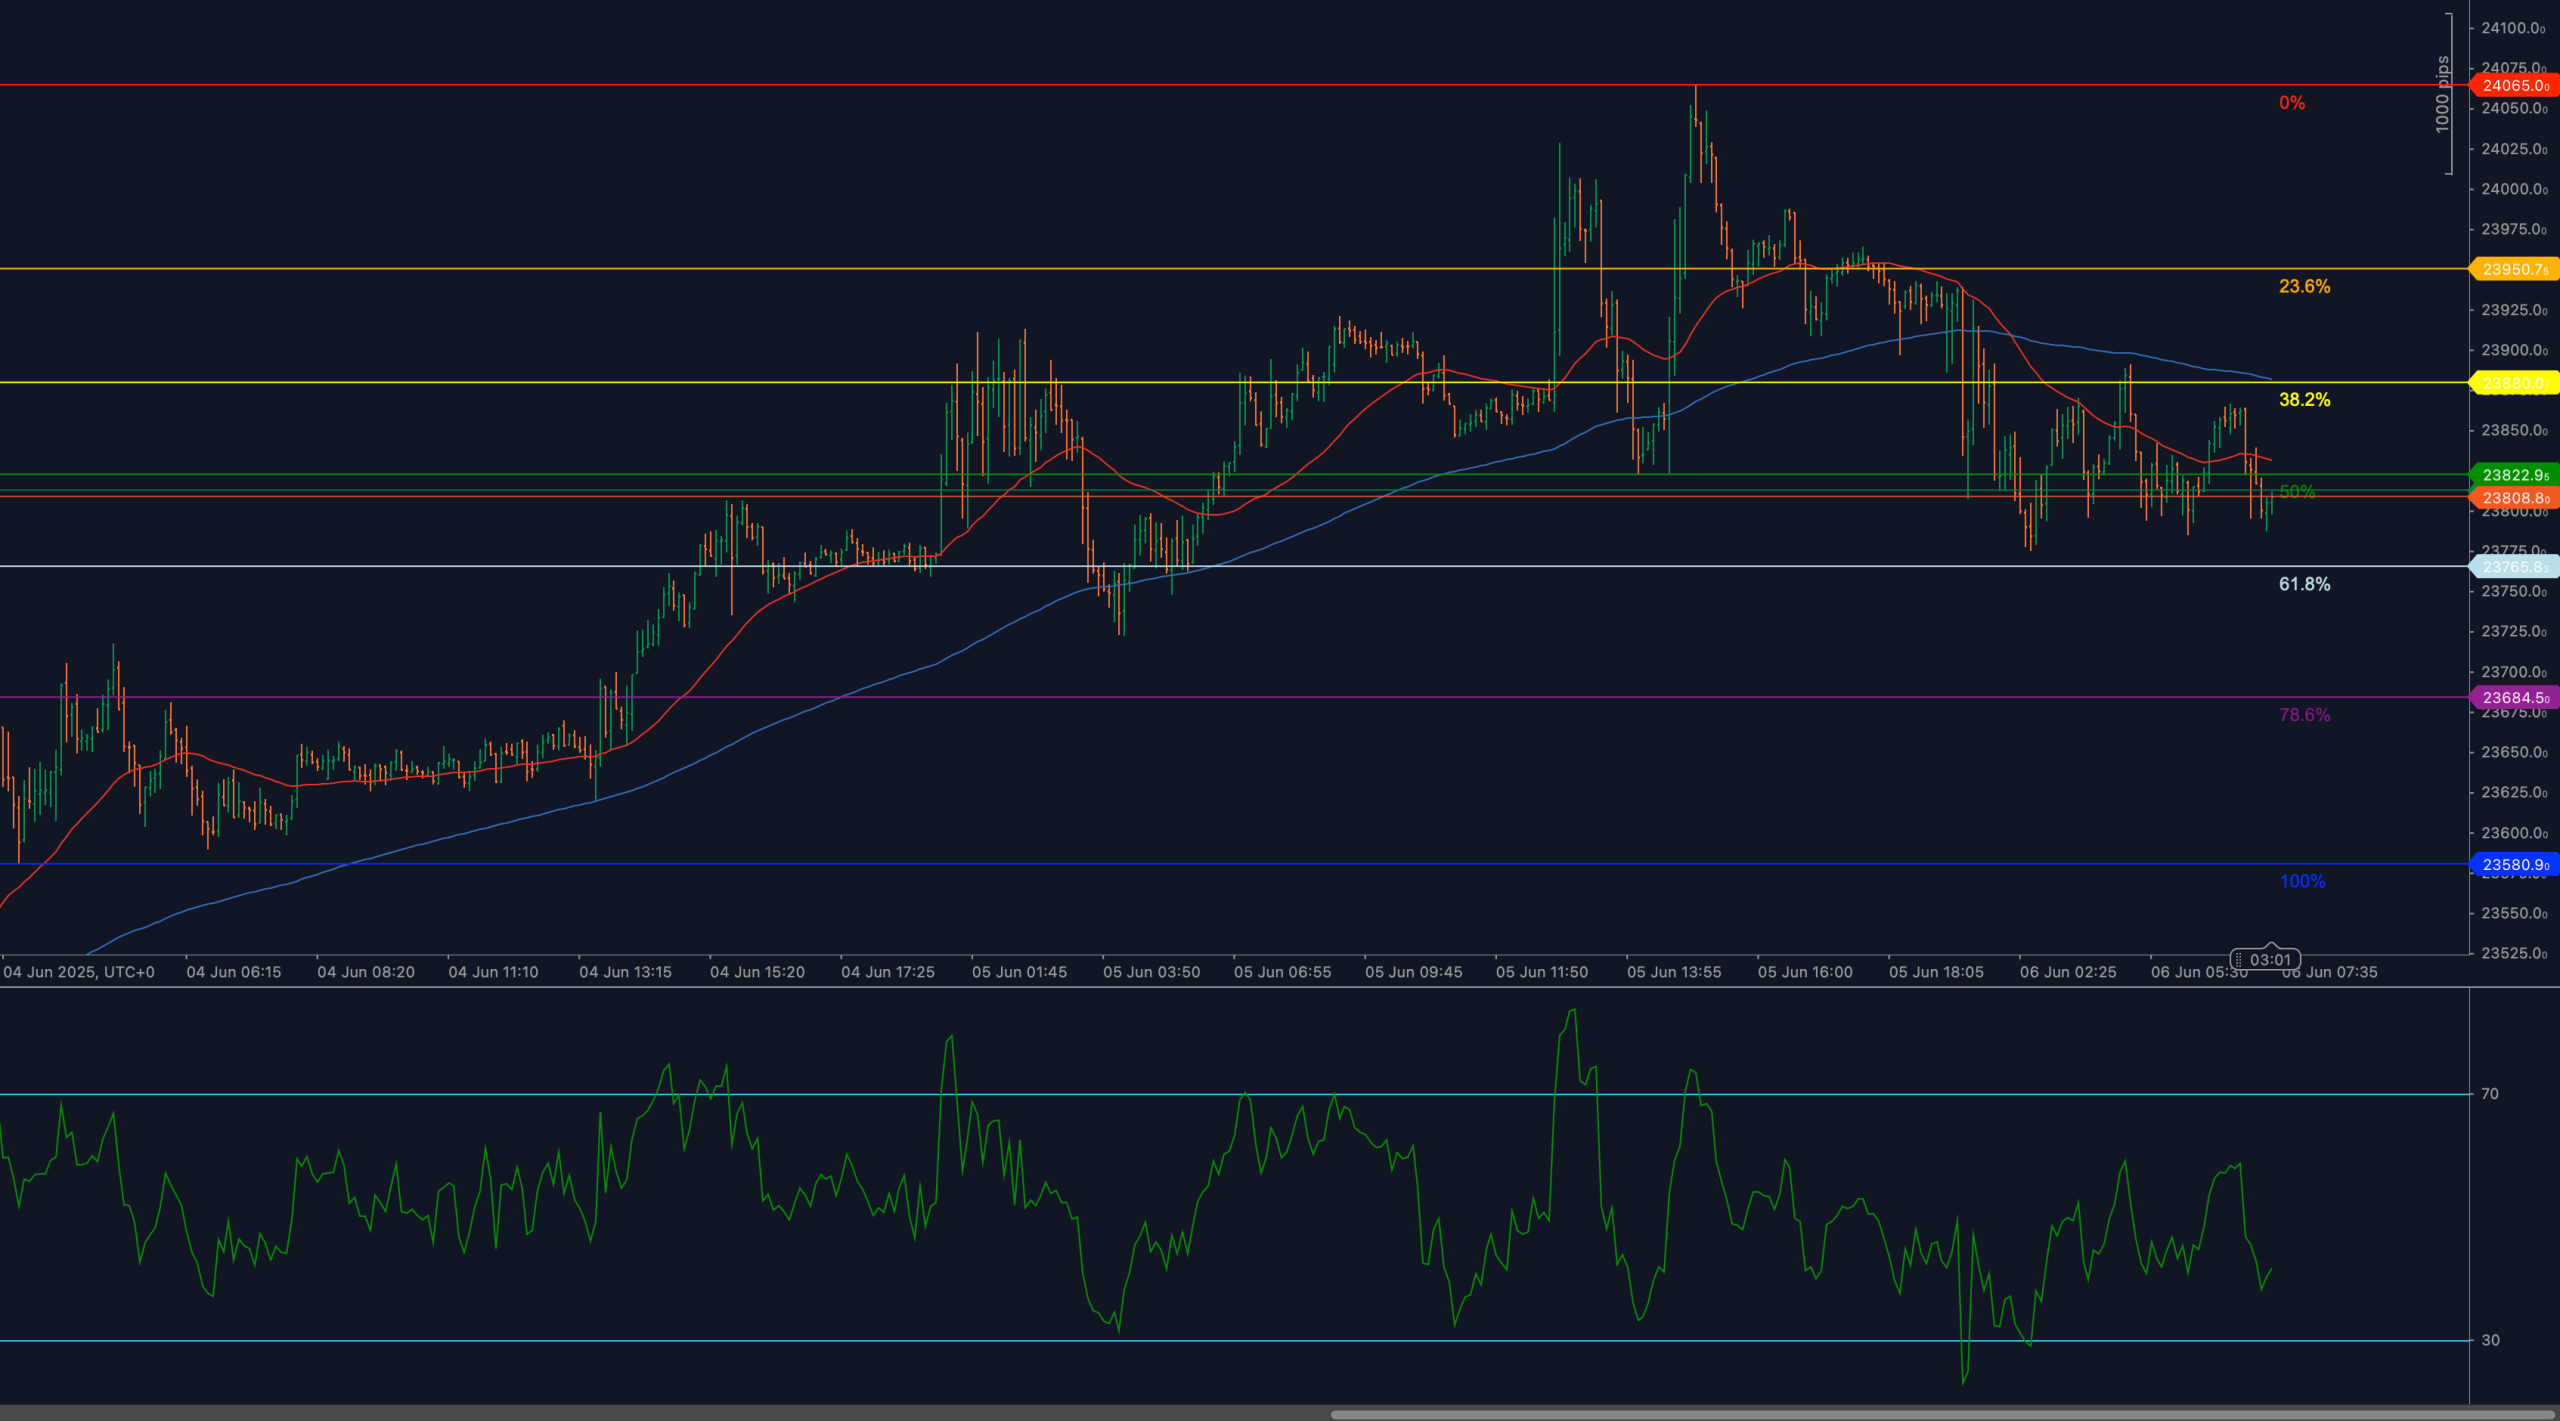
HSI50 attempted to extend its early June recovery but was decisively rejected beneath 23882.9 — the 50% Fibonacci retracement of the 24065.0 to 23580.9 decline. This rejection coincided with dynamic resistance from both the 50-period and 200-period weighted moving averages, which remain in a declining configuration. Price has since slipped back below both indicators, and the initial momentum reversal has begun to materialize, supported by a weakening RSI profile. The rebound, once promising, now appears corrective and incomplete, with the broader technical structure leaning toward another bearish leg.
RSI has failed to reclaim the 60 mark and is now trending lower, reflecting fading bullish conviction. Unless price regains ground above 23882.9 and confirms structural reversal, the current pullback may deepen toward key retracement layers. Traders now watch whether 23750 holds, or if the next Fibonacci support levels come into play.
📈 TECHNICAL ANALYSIS
Key Support and Resistance Levels
HSI50’s initial push toward 23882.9 marked the midpoint of the previous major decline but lacked sufficient strength to break through. This 50% retracement level acted as a clear technical barrier and has since triggered a retreat toward 23808.8 — a minor structural pivot. If this area fails to provide a floor, the next support comes in at 23750, aligning closely with the 61.8% Fibonacci retracement and recent intraday swing lows. A breach here would expose the 78.6% retracement at 23684.5, a zone often targeted by deep pullbacks. On the upside, bulls would need to reclaim 23882.9 with conviction to reestablish control and open the door toward 23956.7 and the full retracement at 24065.0.
Moving Averages and Dynamic Price Action
HSI50 remains constrained beneath both its 50-period and 200-period weighted moving averages, which are now converging and beginning to flatten. This configuration suggests indecision but with bearish tilt as long as price remains below them. Attempts to break through these averages have failed multiple times over the last two sessions, confirming their role as dynamic resistance. Unless price reclaims these moving averages quickly and pushes above 23882.9, momentum is likely to remain biased to the downside. Conversely, a strong bullish candle above both averages would challenge the current bearish structure and potentially initiate trend reversal.
RSI Momentum and Bearish Pressure
The 14-period RSI peaked near 66 during the recent advance but has since turned sharply lower, now hovering around the neutral 50 level. This reversal from near-overbought territory signals that the rally lacked momentum follow-through. RSI is now in a vulnerable zone — if it drops below 45, it would confirm renewed bearish momentum. The previous surge in RSI failed to sustain, which is consistent with failed breakouts and shallow rallies. For bulls to regain momentum, RSI must hold above 50 and push decisively toward 60 again. Otherwise, sellers remain in control of the short-term directional flow.
Candlestick Behavior and Price Action Clarity
Recent candles show upper wicks and compressed bodies, especially around 23882.9, indicating failed breakout attempts and rejection at resistance. The shift from bullish follow-through to indecisive and narrowing candles underscores loss of upward strength. If these patterns continue — particularly with long upper shadows and lack of strong bullish closes — the chart will confirm short-term exhaustion and buildup for a breakdown. Traders should also note the absence of bullish engulfing or hammer patterns near key supports, leaving bearish continuation open as the dominant scenario.
Chart Structure and Breakdown Formation
Structurally, the recent pattern resembles a double rejection or failed flag breakout. After forming a short-term base above 23750, price rallied into the 50% retracement zone but was unable to maintain momentum or breach moving average resistance. This structure, coupled with RSI rejection and moving average compression, suggests a topping pattern within a broader corrective cycle. If price breaks 23750, the short-term structure will shift from neutral-bullish to outright bearish, and downside continuation into 23684.5 and lower becomes the likely path. Only a reclaim of 23882.9 with volume and bullish momentum would disrupt this scenario.
Fibonacci Retracement and Extension Levels
The Fibonacci retracement drawn from the swing low at 23580.9 to the peak at 24065.0 frames the current price behavior. Price is now trading below the 50% retracement at 23882.9 and testing 23808.8, with the next key level at 23750 — the 61.8% retracement and a common support area in corrective pullbacks. Failure to hold above this region could open the path toward the 78.6% retracement at 23684.5, with a deeper move potentially reaching the full retracement zone near 23580.9. On the upside, reclaiming the 50% level at 23882.9 would revive upside prospects toward 23956.7 (23.6%) and ultimately 24065.0. Each level within this retracement structure acts as both a decision point and a sentiment gauge, offering clear invalidation and confirmation zones for technical positioning.
🔍 MARKET OUTLOOK & TRADING SCENARIOS
Bullish Scenario
Price must reclaim 23882.9 and the 200-WMA to shift sentiment. RSI climbing back toward 60+ would signal momentum reentry. Targets in this scenario include 23956.7 and 24065.0, provided volume supports the move.
Neutral Scenario
Rangebound action between 23808.8 and 23882.9, with RSI stuck between 45 and 55, would suggest continued indecision. This could form a new base or consolidate for further downside.
Bearish Scenario
A break below 23750 supported by RSI loss of 50 would confirm a bearish continuation. Targets are 23684.5 and 23580.9, with downside momentum likely to accelerate below 23750.
💼 TRADING CONSIDERATIONS
Traders may look for short setups beneath 23882.9 on rejection signals or bearish candle confirmation. Long positions are only justified on reclaim of that level with RSI support. Until then, the bias remains tilted toward the bears, with volatility likely to increase around key retracement layers.
🏁 CONCLUSION
HSI50 has failed to hold above the 50% retracement at 23882.9 and is now trading under both major moving averages. RSI has turned lower and momentum favors another test of 23750. Unless bulls reclaim lost structure swiftly, deeper pullback scenarios remain in play with targets at 23684.5 and 23580.9.
⚠️ DISCLAIMER
This analysis is for informational purposes only and does not constitute financial advice. Always consult with a licensed financial professional before making trading decisions.


