
📊 MARKET OVERVIEW
The Hang Seng Index (HSI50) has been showing significant recovery momentum after finding a strong foundation at the 23,200 level in mid-March 2025. Currently trading around the 24,100-24,200 range, the index has maintained its position above both the 50-day and 200-day moving averages, which have recently formed a bullish golden cross pattern. This technical development comes amid broader economic uncertainty, yet Hong Kong’s benchmark index continues to demonstrate relative strength as mainland Chinese economic stimulus hopes fuel investor optimism.
📈 TECHNICAL ANALYSIS
What Are the Key Support and Resistance Levels for HSI50?
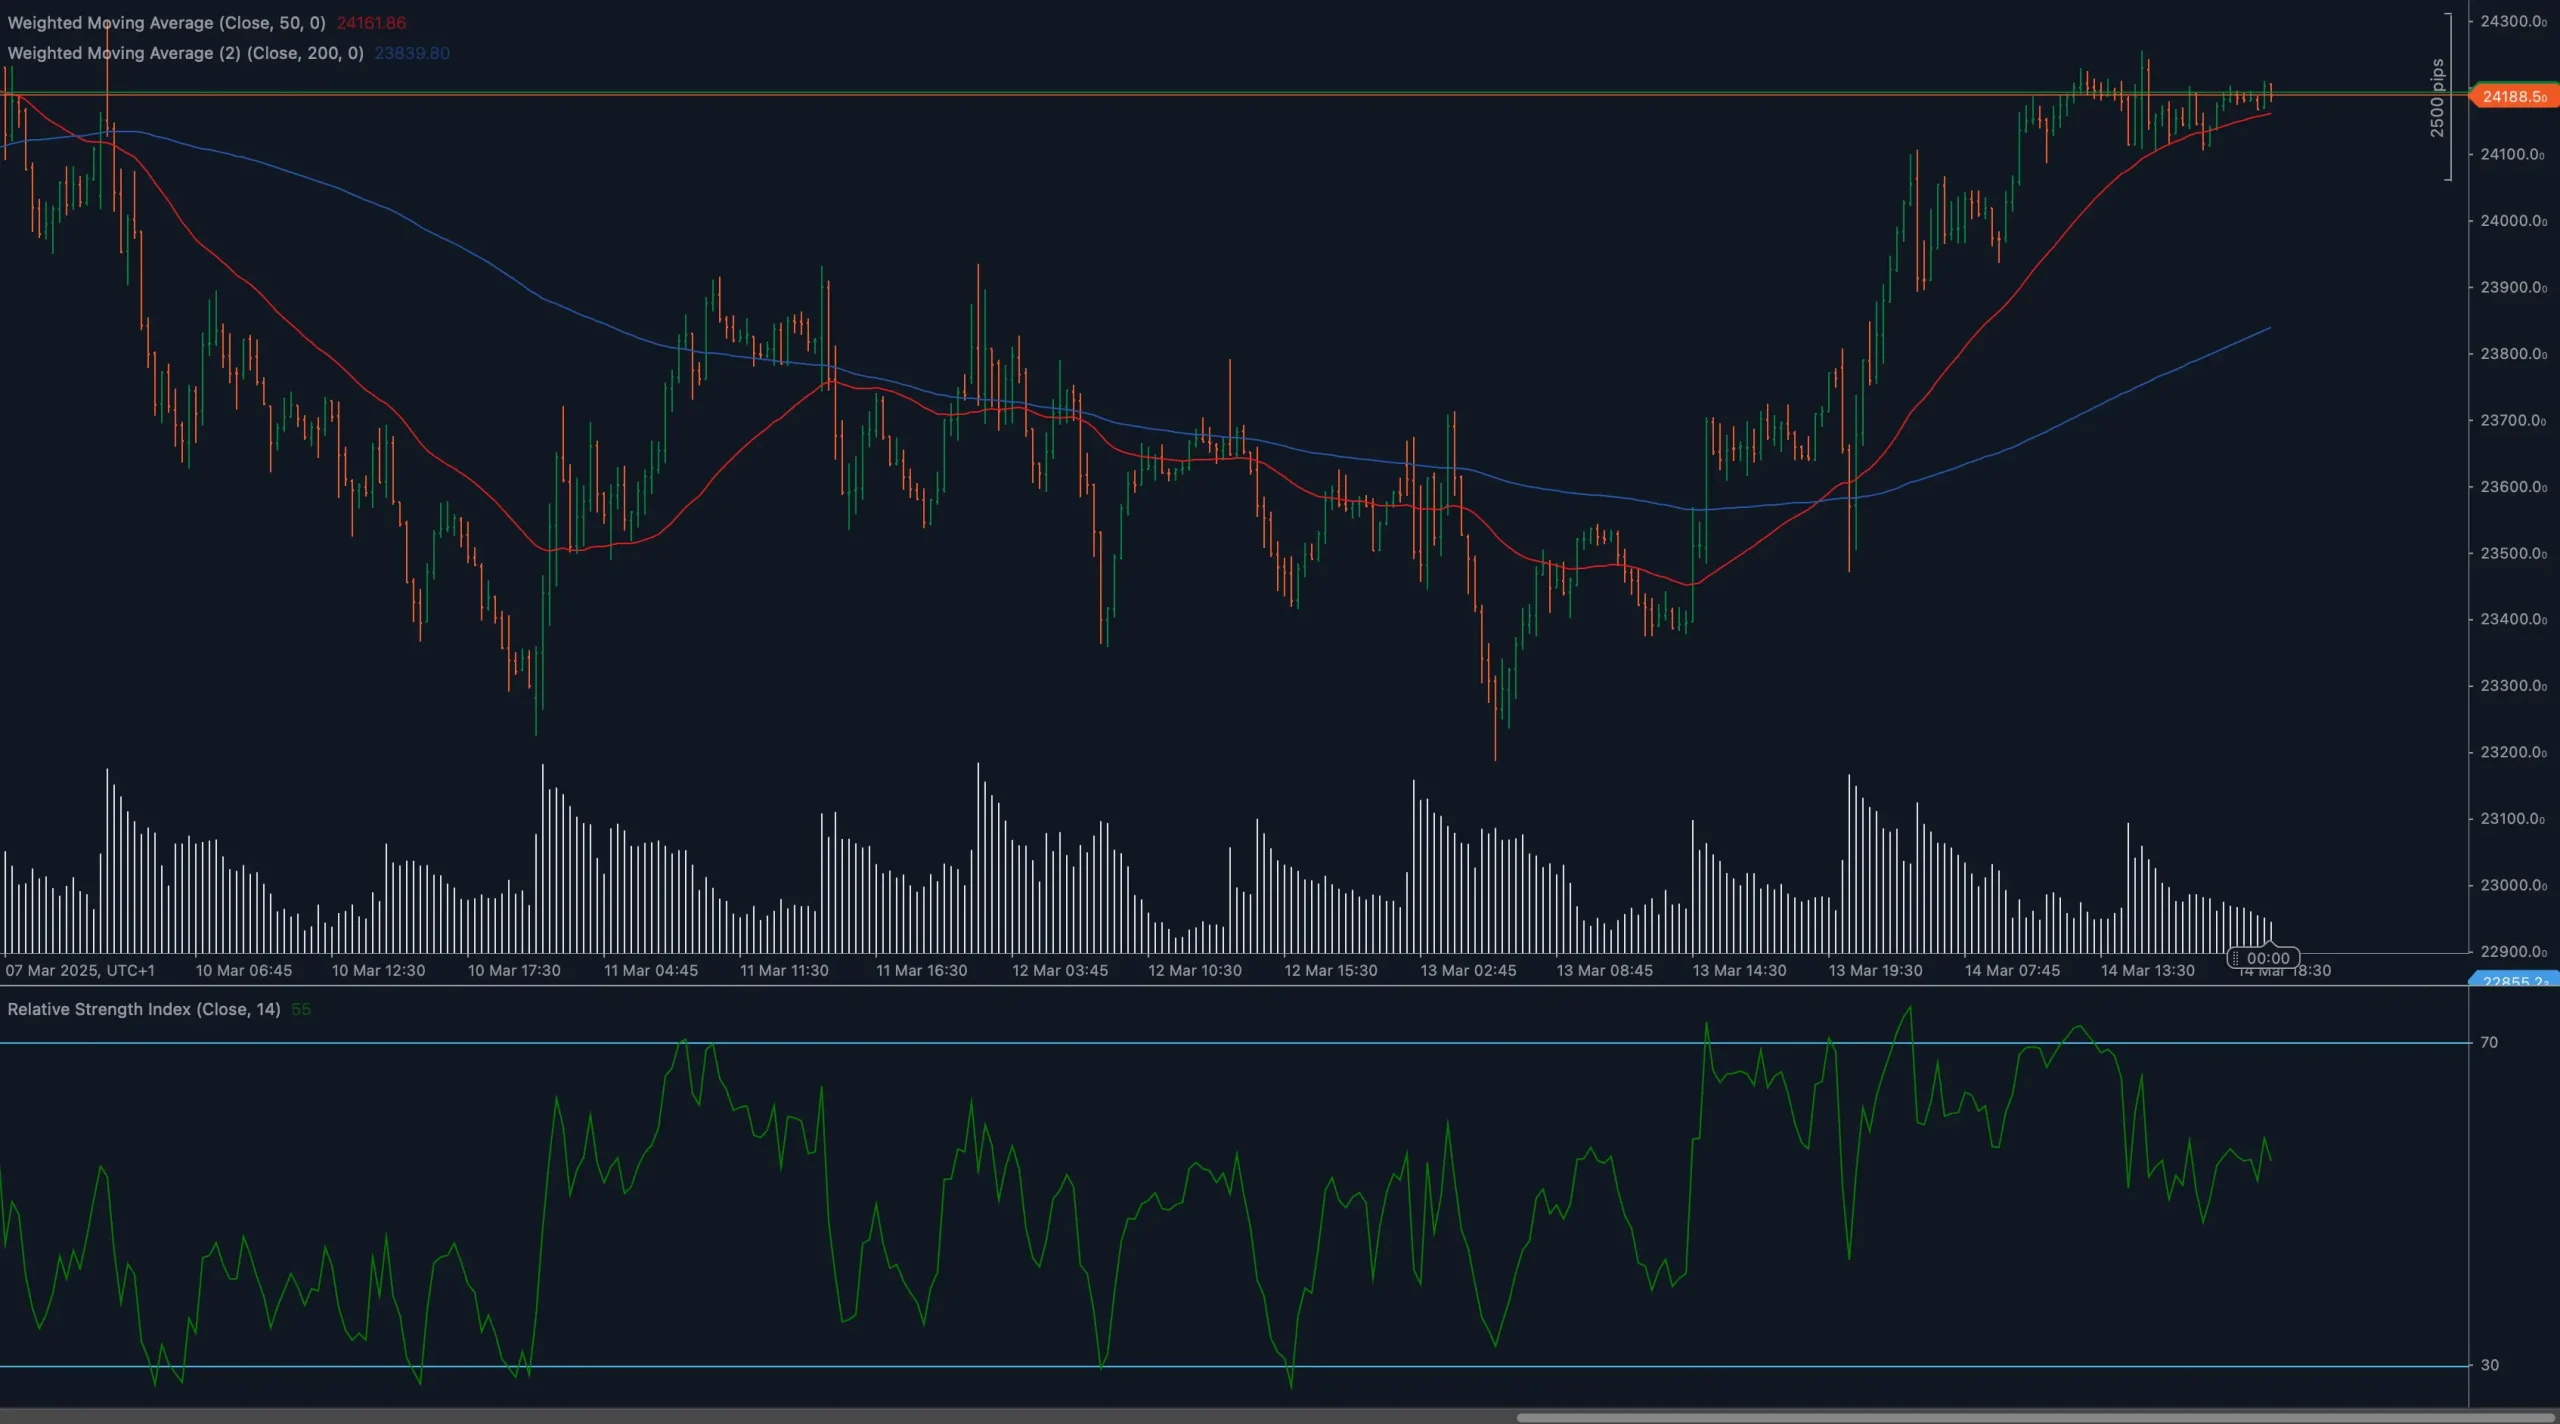
Looking at the HSI50 chart, several critical support and resistance zones are evident. The immediate support level sits at 24,000, which has repeatedly held firm during recent pullbacks. Below this, the secondary support level around 23,700 aligns with the 50-day moving average (red line), while the more significant 23,200 area represents the recent swing low that triggered the current uptrend. On the resistance side, the index faces immediate barriers at 24,300, followed by 24,500 which represents the recent swing high. A breakthrough above these levels could trigger a move toward the 25,000 psychological level.
Moving Average Analysis and Dynamic Price Levels
The moving average setup for HSI50 presents a decidedly bullish picture. The 50-day moving average (shown in red at approximately 24,180) has recently crossed above the 200-day moving average (shown in blue at approximately 23,600), forming a golden cross pattern. This technical event typically signals a potential longer-term bullish trend. Price is currently consolidating above both these dynamic support levels, which provides a technical foundation for potential further upside. The rising trajectory of both moving averages further confirms the positive momentum structure.
RSI Momentum Analysis and Divergence Patterns
The Relative Strength Index (RSI) indicator, set at 14 periods, shows moderately bullish readings between 50-60, indicating healthy momentum without being overbought. Looking at the RSI trajectory, we can observe that it has maintained readings above the 50 midline throughout most of the recent price action, suggesting underlying strength in the current trend. No significant divergences are currently visible between price and RSI, which typically indicates congruence between momentum and price action. The RSI pullback from higher levels indicates a cooling of momentum rather than a reversal signal.
Price Action and Candlestick Analysis
Recent candlestick formations for HSI50 reveal a period of consolidation following the stronger bullish impulse move from the 23,200 level. The presence of several small-bodied candles with upper and lower wicks suggests market indecision at current levels, though the overall bias remains positive as prices continue to hold above key moving averages. The price action has formed a sequence of higher lows, which is a classic sign of bull market behavior. The most recent candles show diminishing volatility, potentially setting up for another directional move as energy builds.
Chart Patterns and Formation Analysis
The HSI50 has formed a potential bull flag pattern over the recent trading sessions, following the strong upward impulse from the 23,200 level. This consolidation pattern in an uptrend typically resolves to the upside. Additionally, the overall price structure since mid-March shows an inverse head and shoulders pattern completion, with the neckline around the 24,000 level now serving as support. The measured move target from this pattern suggests potential movement toward the 25,000 region if the pattern fully materializes as expected.
Fibonacci Retracement Levels and Extension Targets
Applying Fibonacci retracement to the move from the recent low at 23,200 to the high around 24,500, we can identify key retracement levels. The 38.2% retracement level aligns closely with the 24,000 support zone, adding technical significance to this area. For potential targets, the 127.2% Fibonacci extension projects toward 24,850, while the 161.8% extension points to a target near 25,300. These levels provide reasonable objectives for bulls if the current supportive market structure remains intact and momentum accelerates to the upside.
🔍 MARKET OUTLOOK & TRADING SCENARIOS
Bullish Scenario for HSI50
In the bullish scenario, HSI50 maintains its position above the golden cross of the 50 and 200-day moving averages and builds momentum to break above immediate resistance at 24,300. Successful clearance of this level would likely trigger buying interest toward 24,500, with follow-through potential to the 25,000 psychological barrier. This scenario is supported by the current positive moving average alignment and would gain further credibility if volume increases on upward price movements. The RSI would likely push toward the 70 level in this case, though without necessarily becoming overbought.
Neutral Scenario for HSI50
The neutral outlook involves continued consolidation between support at 24,000 and resistance at 24,300. In this scenario, the index would trade sideways, respecting both boundaries while market participants await fresh catalysts. The moving averages would continue to provide dynamic support, but momentum would be insufficient to trigger breakouts. This range-bound activity could persist for several sessions, with the RSI oscillating around the midline between 40-60. This scenario often precedes a more significant directional move once the consolidation phase completes.
Bearish Scenario for HSI50
If bearish pressure intensifies, HSI50 could break below the critical 24,000 support level, potentially testing the 50-day moving average around 23,700. A close below this dynamic support would signal deteriorating market conditions and could accelerate selling toward the 23,200 previous low. This scenario would likely be accompanied by the RSI breaking below the 40 level and moving averages flattening their positive slope. However, the recent golden cross formation makes this scenario less probable unless fundamental factors significantly shift market sentiment.
💼 TRADING CONSIDERATIONS
When trading the Hang Seng Index, it’s essential to consider both technical factors and broader market influences. The current technical setup suggests maintaining a cautiously bullish bias while implementing proper risk management. For long positions, consider entries near support at 24,000 with stop losses below the 23,700 level to limit downside exposure. Traders might use a scaled approach, taking partial profits at 24,300 and 24,500 while trailing stops on remaining positions.
For more conservative traders, waiting for a confirmed breakout above 24,300 with increased volume provides a higher probability setup, albeit with slightly reduced reward-to-risk ratios. Short-term traders can also consider range-trading strategies between 24,000 and 24,300 during the consolidation phase, while being prepared to adapt if a breakout occurs in either direction.
Remember that the Hang Seng Index is particularly sensitive to developments in mainland China, global risk sentiment, and changes in U.S. dollar strength. Always monitor these external factors alongside technical analysis when trading HSI50.
🏁 CONCLUSION
The Hang Seng Index (HSI50) currently displays a technically constructive picture with price maintaining above the critical 24,000 support level and both key moving averages. The recent golden cross formation between the 50-day and 200-day moving averages provides a significant bullish signal that increases the probability of continued upside movement. While short-term consolidation is evident, the underlying technical structure remains positive.
Traders and investors should closely monitor the 24,000 support level, as maintaining price action above this threshold is crucial for the bullish scenario to remain intact. The potential bull flag pattern currently forming suggests that a breakout could materialize in the coming sessions, with initial targets at 24,500 followed by the psychologically important 25,000 level. However, prudent risk management remains essential given the inherent volatility of this market.
⚠️ DISCLAIMER
This technical analysis is provided for informational purposes only and should not be considered as financial advice. Trading financial instruments, including the Hang Seng Index (HSI50), involves significant risk and can result in loss of capital. Past performance does not guarantee future results. All traders should use risk management techniques and trade with capital they can afford to lose. Always conduct your own research and consider consulting with a financial advisor before making investment decisions.


