
📊 MARKET OVERVIEW
The EURO STOXX 50 (ESX50), Europe’s leading blue-chip index, is currently displaying significant bearish momentum as it trades below both key moving averages. The index has been experiencing increased volatility since late February 2025, with a notable downward trajectory forming after rejection from the 5580 resistance zone. This technical posture reflects broader economic uncertainties in the Eurozone, including concerns about growth forecasts, inflation persistence, and monetary policy outlook. The ESX50’s recent price action suggests institutional investors are adopting a more cautious stance toward European equities.
Market sentiment for European stocks appears increasingly cautious as the ESX50 struggles to maintain support levels that previously acted as strong foundations. Trading volume has shown notable spikes during selloff periods, indicating conviction behind the bearish moves, while buying pressure appears more modest during attempted recoveries. This asymmetrical volume profile reinforces the current negative bias for the index.
📈 TECHNICAL ANALYSIS
What Are the Key Support and Resistance Levels for ESX50?
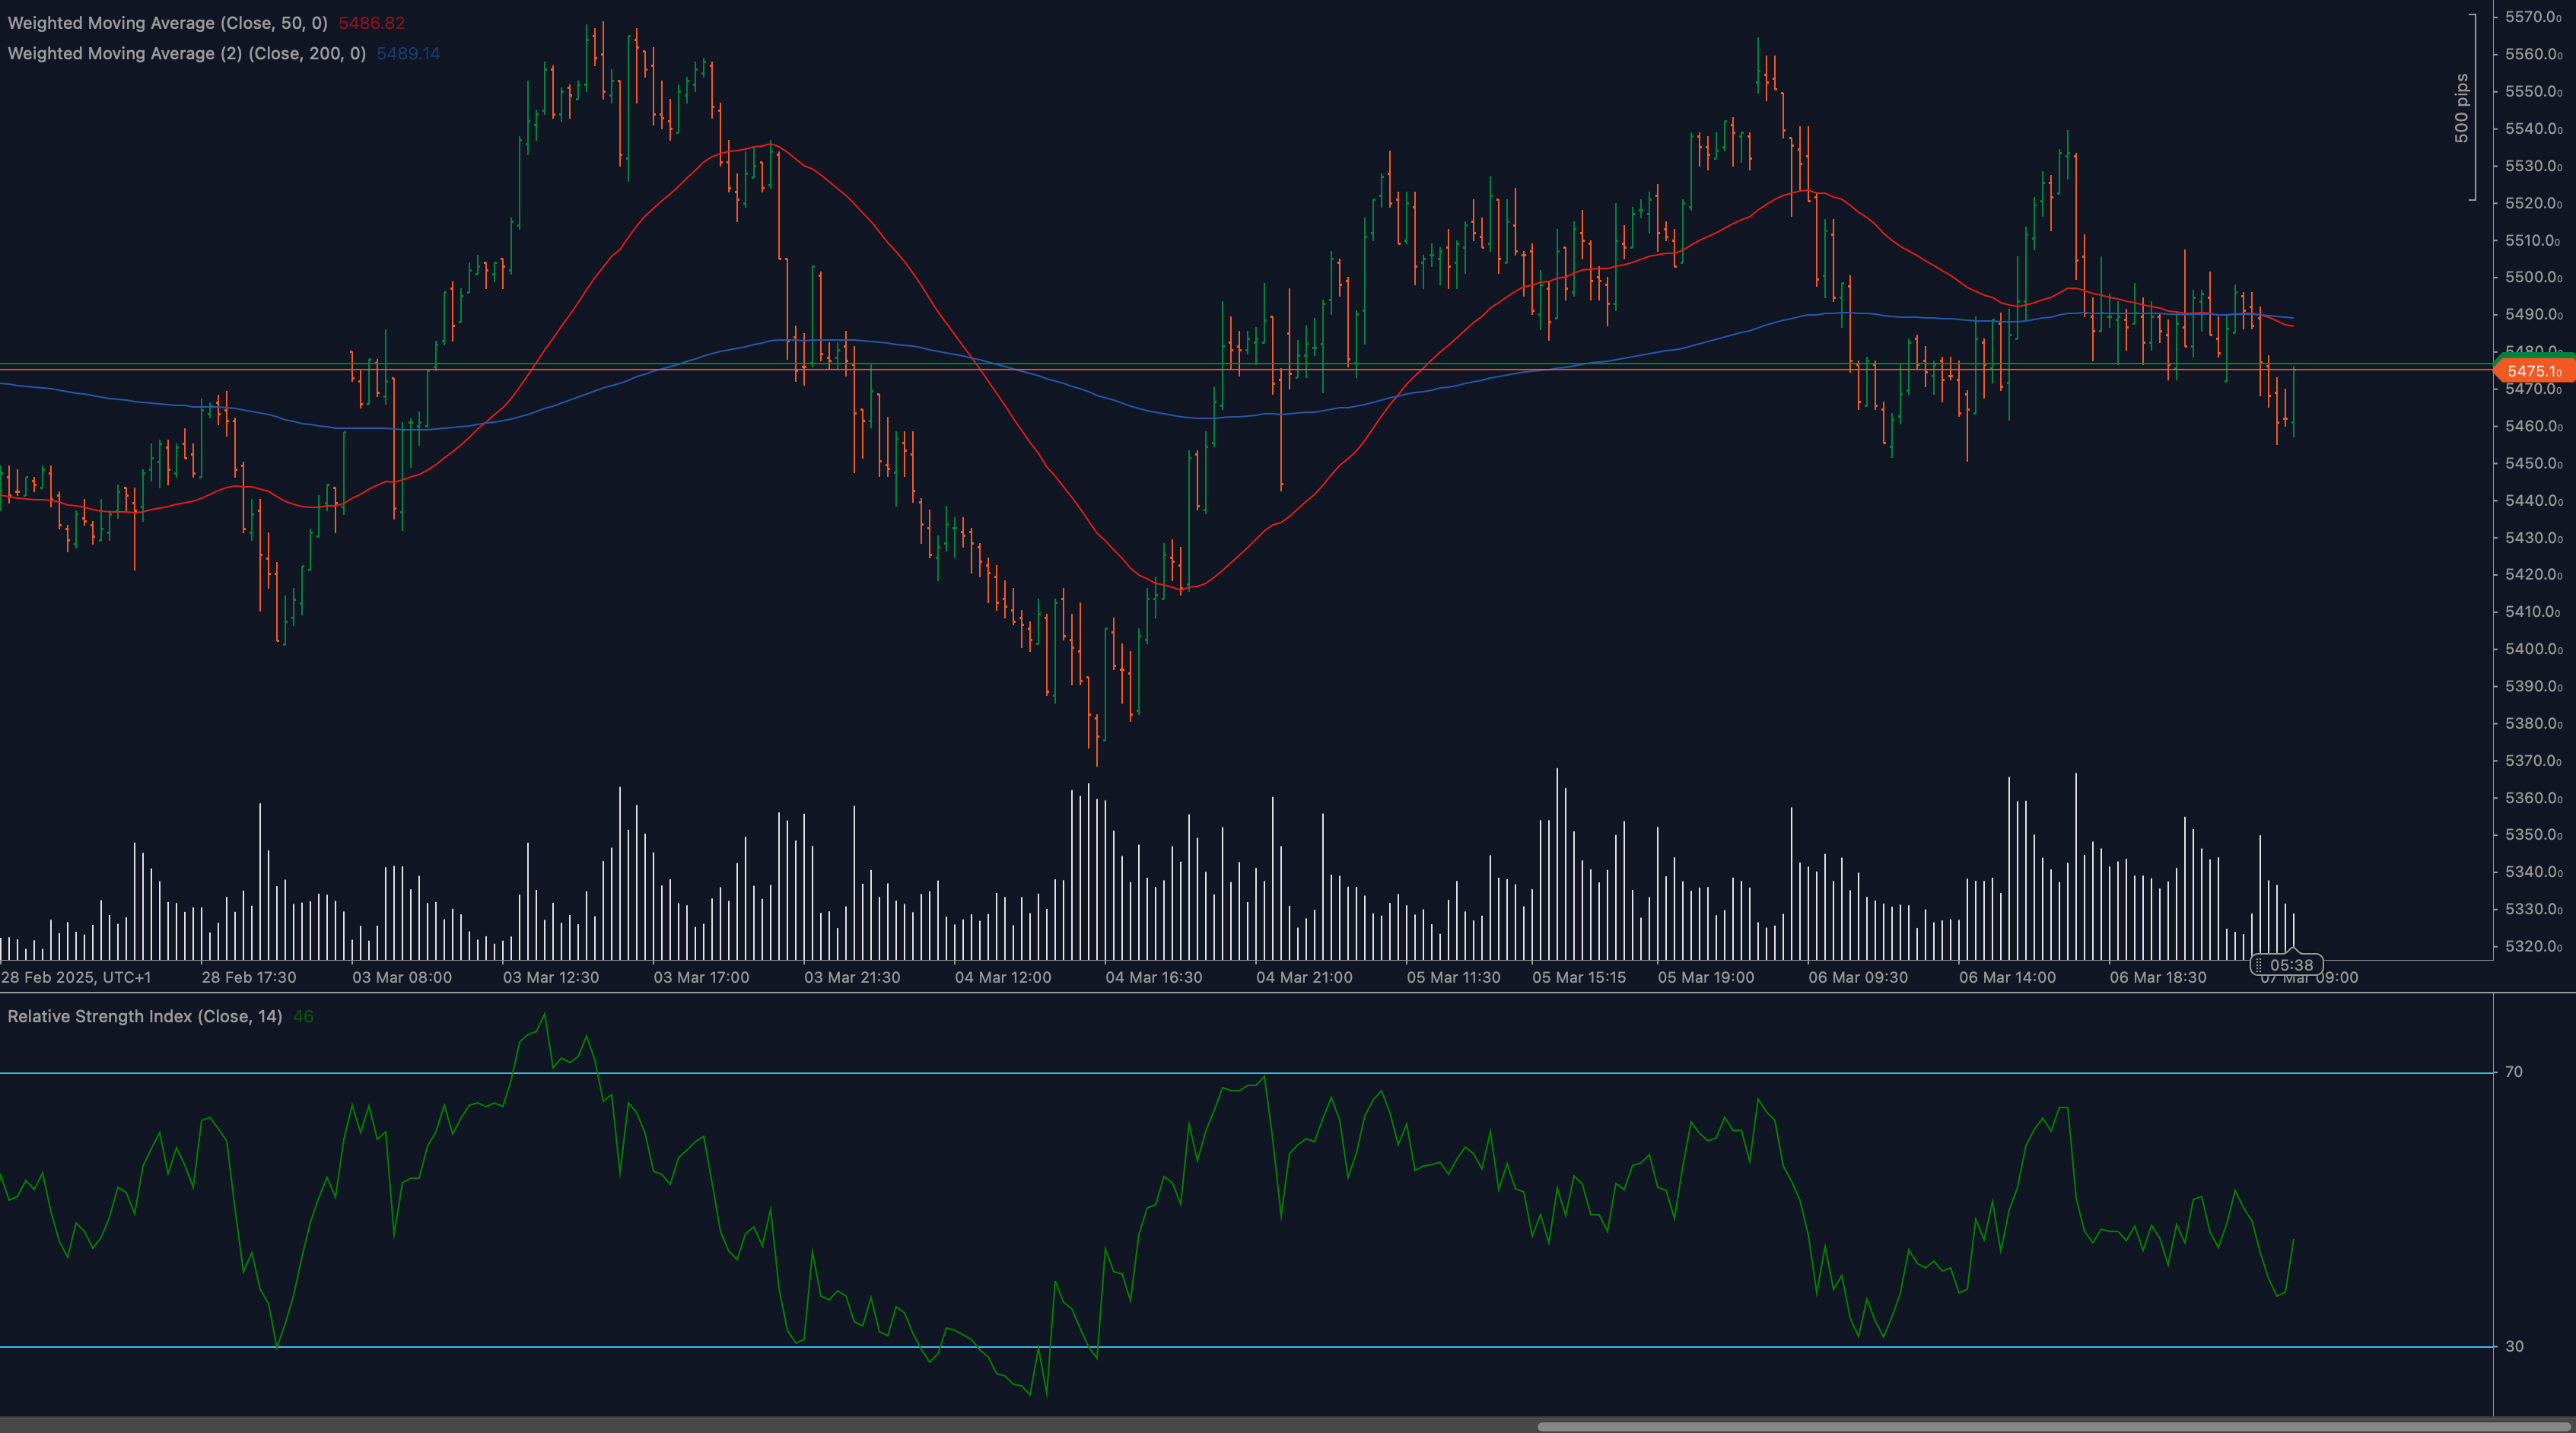
The ESX50 is currently trading near a critical support zone at 5470, which has previously served as both resistance and support in late February and early March. Should this level fail to hold, the next significant support appears at the 5420 level, followed by the more substantial 5380 zone where previous market structure formed. The immediate resistance levels are positioned at 5520 (coinciding with the 200-day moving average) and 5580, where recent rallies have been firmly rejected. The 50-day moving average currently at approximately 5490 is acting as dynamic resistance, creating a compression zone between this moving average and the 5470 support.
Moving Average Analysis
The positioning of both major moving averages provides critical insight into the ESX50’s current technical structure. The 50-day moving average (red line) is positioned above the 200-day moving average (blue line), technically maintaining a bullish long-term bias, but price action has decisively broken below both indicators. This suggests a potential trend shift may be underway. The 50-day MA has flattened and appears to be rolling over, indicating weakening momentum in the intermediate timeframe. The price is currently compressed between these two moving averages, creating a high-tension technical zone that often precedes significant directional moves.
Relative Strength Index (RSI) Evaluation
The 14-period Relative Strength Index shown on the chart is hovering in neutral territory around the 45-50 level, indicating neither extreme oversold nor overbought conditions. However, the RSI has formed lower highs in recent weeks, diverging from the price action that attempted to establish higher lows. This bearish divergence suggests underlying weakness in the buying momentum. The RSI’s failure to breach and hold above the 60 level during recent rallies indicates limited bullish conviction. For a potential trend reversal, traders should watch for RSI to establish higher lows and move above the 60 threshold with conviction.
Price Action and Candlestick Patterns
Recent candlestick formations reveal a dominant bearish bias, with several notable bearish engulfing patterns forming at resistance levels. The most recent price action shows rejection wicks at the 50-day moving average, indicating selling pressure emerging whenever the index approaches this dynamic resistance. Multiple attempts to rally have resulted in bearish reversal candles, suggesting persistent selling interest at higher levels. The last several candles display long upper shadows, indicating that bulls have been unable to maintain control even during intraday rallies. For a bullish reversal to gain credibility, the ESX50 would need to form a series of higher lows coupled with strong-bodied bullish candles that close above both moving averages.
Chart Patterns and Market Structure
The ESX50 appears to be forming a potential descending channel, with a series of lower highs and lower lows since the rejection at the 5580 level. This structure suggests continued bearish pressure as long as the upper boundary of the channel remains intact. There’s also the possibility of a larger inverse head and shoulders pattern developing if support at 5470 holds and creates a right shoulder. However, confirmation would require a decisive break above the neckline at approximately 5520-5530. The current market structure maintains a bearish bias until price can regain territory above both major moving averages and establish higher lows and higher highs.
Fibonacci Retracement Levels
Analyzing the recent swing high to swing low, key Fibonacci retracement levels provide additional context for potential reversal zones. The 38.2% retracement level coincides closely with the 5520 resistance area, while the 50% retracement aligns near the 5580 zone. These mathematical levels reinforce the importance of these resistance zones. On the downside, the 127.2% Fibonacci extension projects toward the 5400 level, which could become a target if current support fails to hold. Traders should particularly note the confluence between Fibonacci levels and previously established support/resistance zones, as these areas of technical agreement often provide the strongest reaction points.
🔍 MARKET OUTLOOK & TRADING SCENARIOS
Bearish Scenario
The primary scenario, supported by current technical indicators, suggests continued bearish pressure on the ESX50. If the critical 5470 support level breaks with conviction (confirmed by increased volume and a daily close below this threshold), we could witness an accelerated move toward the 5420 support zone, potentially extending to test the 5380 area where significant previous structure exists. The bearish case gains additional strength from the positioning below both major moving averages and the negative divergence on the RSI. European economic concerns could further catalyst downside momentum, particularly if upcoming economic data disappoints or ECB policy appears misaligned with market expectations.
Neutral Scenario
A consolidation scenario may develop if the ESX50 maintains position between the 5470 support and 5520 resistance levels. This condensed trading range would reflect market indecision and potentially lead to a period of decreased volatility as traders await fresh catalysts. In this scenario, we might observe decreasing volume and narrowing daily ranges, with the RSI oscillating in the middle zone between 40-60. This period of indecision could persist until a significant fundamental catalyst or technical breakout occurs. Traders should prepare for possible false breakouts in either direction during consolidation phases, which are common in range-bound market conditions.
Bullish Scenario
For a bullish reversal to materialize, the ESX50 would need to reclaim territory above the 50-day moving average around 5490 and subsequently break above the 5520 resistance with conviction. Such a move would need to be accompanied by increasing volume and bullish candlestick formations. If achieved, this would initially target the 5580 resistance level, with potential for extension toward 5650 if momentum builds. The bullish case would gain substantial credibility if the RSI breaks above the 60 level and forms higher lows during any retracements. Improved economic data from key Eurozone economies or a more dovish shift in ECB policy could serve as fundamental catalysts for such a reversal.
💼 TRADING CONSIDERATIONS
Traders approaching the ESX50 in current conditions should maintain strict risk management given the conflicting technical signals and elevated volatility. For short positions, logical entry points emerge on any retest of the 50-day moving average or the 5520 resistance level, with protective stops placed just above the 5580 zone. Target projections for bearish trades align with the 5420 and 5380 support levels. Conversely, traders with a bullish bias might consider counter-trend opportunities if strong reversal candles form at the 5470 support level, with stops placed below 5450 and initial targets at the 50-day moving average.
Position sizing should be conservative given the current technical uncertainties surrounding the ESX50. The Average True Range (ATR) suggests daily volatility of approximately 30-40 points, which should inform stop placement strategies. Traders might consider implementing options strategies such as put spreads to capitalize on continued downside while defining maximum risk, or utilizing iron condors if expecting range-bound conditions to persist.
Correlation analysis with other European indices (particularly the DAX40 and CAC40) and the broader global equity market sentiment should be incorporated into trading decisions. The ESX50’s movements often anticipate or follow patterns in these related markets. Additionally, monitoring EUR/USD dynamics and European bond yields provides crucial context for potential equity market direction, as currency strength and rising yields have historically placed pressure on European equities.
🏁 CONCLUSION
The technical picture for the EURO STOXX 50 (ESX50) currently leans bearish, with price action below key moving averages and multiple resistance levels capping upside attempts. The critical 5470 support represents a decisive technical threshold that will determine the index’s near-term trajectory. Traders should remain vigilant to potential catalysts that could drive the next significant move, with particular attention to price action around the identified support and resistance zones.
While bearish momentum currently dominates, the consolidation between moving averages suggests potential energy building for an eventual directional move. Risk management remains paramount, with clearly defined entry points, stop-loss levels, and profit targets essential for navigating the current technical landscape of the ESX50. As European economic conditions evolve and monetary policy developments unfold, these fundamental factors will interact with the technical structure to shape the next significant trend for this benchmark European equity index.
⚠️ DISCLAIMER: This analysis is for informational purposes only and should not be considered financial advice. Trading carries risk, and past performance does not guarantee future results. Conduct independent research before making investment decisions.


