
📊 Market Overview
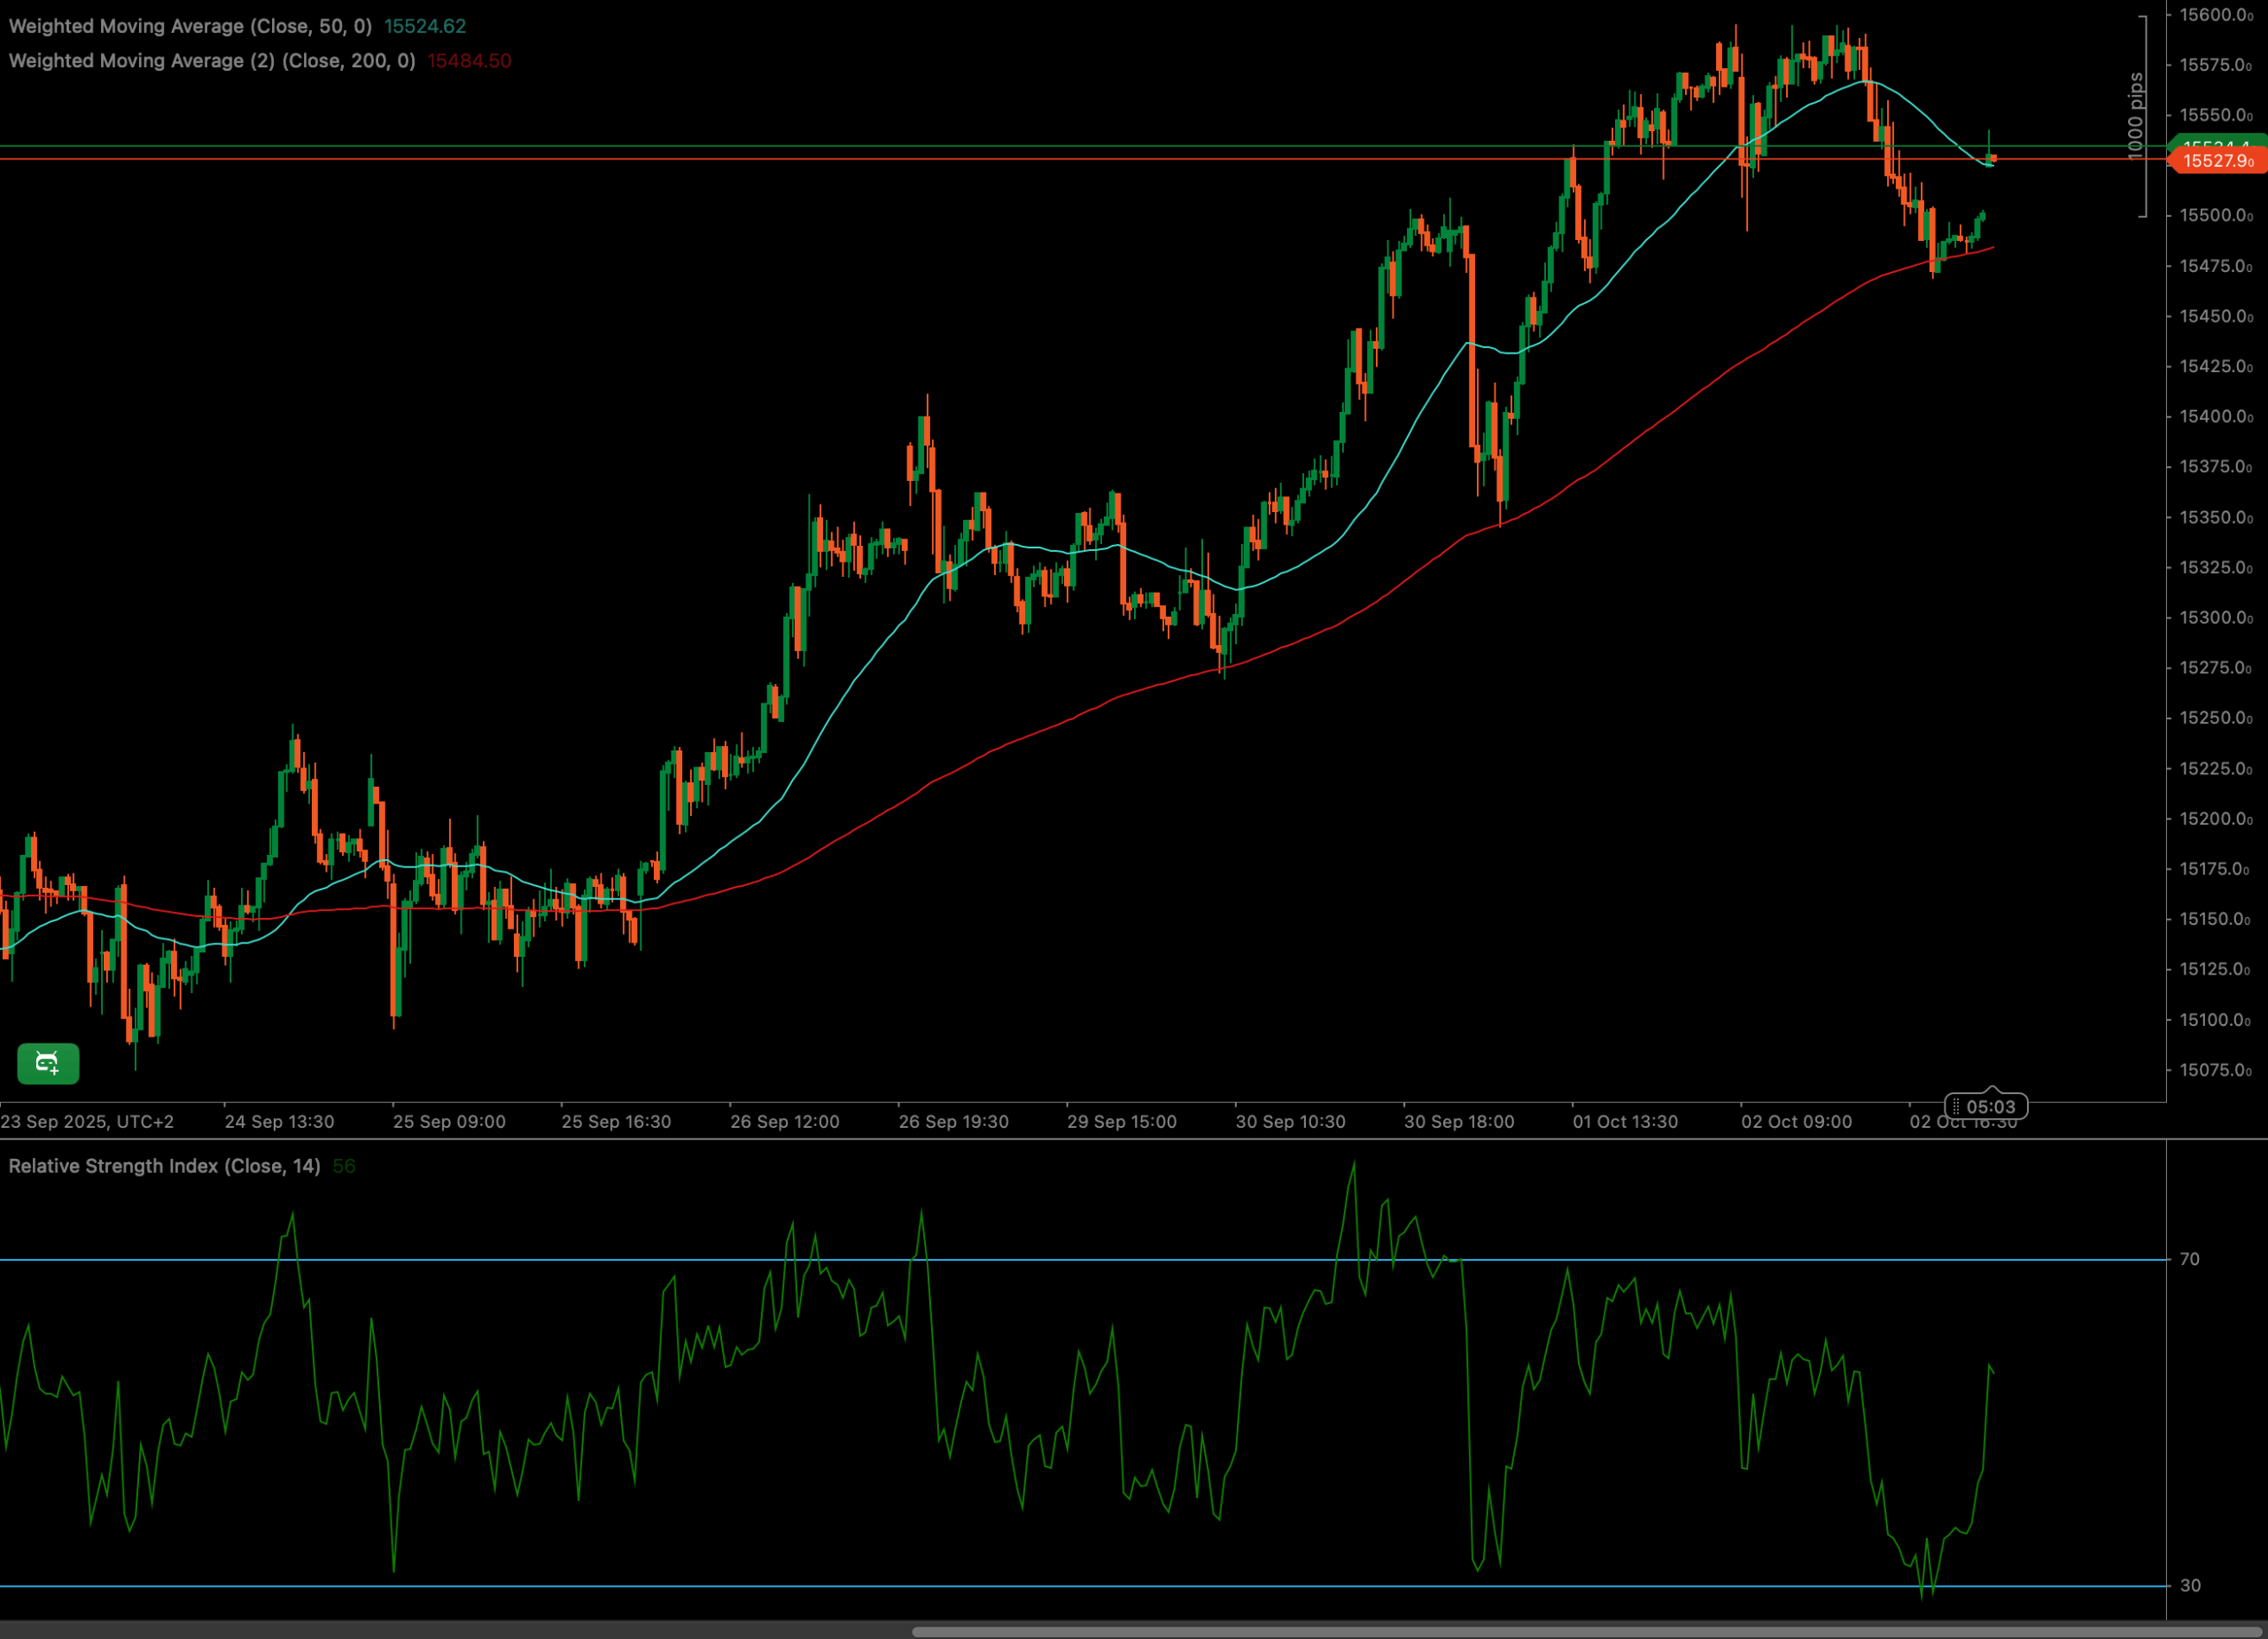
The ESP35 index has demonstrated significant volatility, characterized by a powerful uptrend through late September that culminated in a new short-term high above the 15,600 level around October 1st. This bullish phase was immediately followed by a sharp correction, indicating aggressive profit-taking. The index is now consolidating in a critical zone, having found support precisely at the 200-period Weighted Moving Average (WMA), and is currently battling resistance at the 50-period WMA.
After a sustained bullish surge where the price consistently rode above the 50 WMA, the index experienced a rapid decline that erased a significant portion of its recent gains. This price action has brought the index to a pivotal decision point, caught between key dynamic support and resistance levels, leaving traders to watch for the next directional move.
📈 Technical Analysis
Key Support and Resistance Levels
The immediate resistance for the ESP35 is clearly defined by the 50-period Weighted Moving Average (WMA), currently around 15,525. A break above this could see the index re-test the recent swing high above 15,600. On the downside, crucial dynamic support was established at the 200-period WMA, near the 15,485 level. A failure to hold this support would signal further bearish pressure.
Moving Average Analysis for ESP35
The chart clearly shows the 50 WMA (cyan line) crossing above the 200 WMA (red line) around September 25th, confirming the start of the strong uptrend. During this rally, the price remained firmly above the 50 WMA. The recent correction, however, saw a decisive break below the 50 WMA, signaling a shift in short-term momentum. The subsequent bounce precisely off the 200 WMA underscores its significance as a major support level. The index is now in a classic squeeze between these two key moving averages.
RSI and Momentum Shift in ESP35
The Relative Strength Index (RSI) effectively foreshadowed the recent pullback. As the ESP35 pushed to its highs around September 30th and October 1st, the RSI entered overbought territory above the 70 level, suggesting the rally was overextended. The subsequent price drop saw the RSI plummet towards the oversold threshold of 30, bottoming out in sync with the price touching the 200 WMA. The RSI has since recovered to a neutral reading around 56, indicating that the immediate selling pressure has subsided, but bullish momentum has not yet fully returned.
Volume Spike and Market Participation
While specific volume data is not visible on this chart, observing volume alongside price action is crucial for confirming trends. The sharp decline from the peak was likely accompanied by a spike in selling volume. For a bullish continuation, traders should look for increasing buying volume as the price challenges the 50 WMA. Conversely, a high-volume break below the 200 WMA would strongly confirm a bearish scenario for the ESP35.
Candlestick Tone and Market Reaction for ESP35
The candlestick patterns for the ESP35 tell a clear story. The rally was characterized by strong, consecutive green candles. The reversal from the top was marked by long-bodied red candles, signifying dominant selling pressure. At the current juncture, between the 50 and 200 WMAs, the candles have become smaller with more prominent wicks, indicating a period of consolidation and indecision as buyers and sellers fight for control at this critical technical level.
🔍 Market Outlook & Trading Scenarios
Bullish Scenario
If the ESP35 can decisively break and hold above the 50 WMA resistance at ~15,525, it would signal that the corrective phase is over. This could pave the way for a retest of the recent highs above 15,600, potentially resuming the broader bullish trend.
Neutral Scenario
The ESP35 could remain range-bound between the 200 WMA support (~15,485) and the 50 WMA resistance (~15,525). This sideways consolidation would reflect market uncertainty as participants await a fresh catalyst to drive the next directional move.
Bearish Scenario
A rejection from the 50 WMA followed by a convincing break below the 200 WMA support at ~15,485 would be a strong bearish signal. This could trigger a new wave of selling, targeting lower support levels, potentially around the 15,350-15,400 zone seen in late September.
💼 Trading Considerations
- Bullish setup: Look for a confirmed close above the 50 WMA (~15,525) on strong volume. An initial target would be the recent peak above 15,600.
- Breakout setup: A break above 15,525 signals a potential long entry. Conversely, a break below the 200 WMA at ~15,485 could signal a short entry, targeting the next support zone.
- Bearish setup: A confirmed rejection at the 50 WMA followed by a breakdown below the 200 WMA (~15,485) would provide a short opportunity, with initial targets around 15,400.
🏁 Conclusion
The ESP35 is at a critical technical crossroads. The battle between the 50 WMA resistance and the 200 WMA support will likely dictate its near-term direction. The RSI has neutralized after the recent sharp moves, providing no strong directional bias at the moment, which reinforces the theme of consolidation and indecision.
Traders should exercise caution and wait for a confirmed break of this consolidation range. A decisive move above the 50 WMA (~15,525) could reignite bullish sentiment, while a breakdown below the 200 WMA (~15,485) would confirm that bears have taken control for the short term.
⚠️ Disclaimer
This analysis is for informational purposes only and does not constitute financial advice. Always consult a licensed financial advisor before making trading decisions.


