
📊 MARKET OVERVIEW
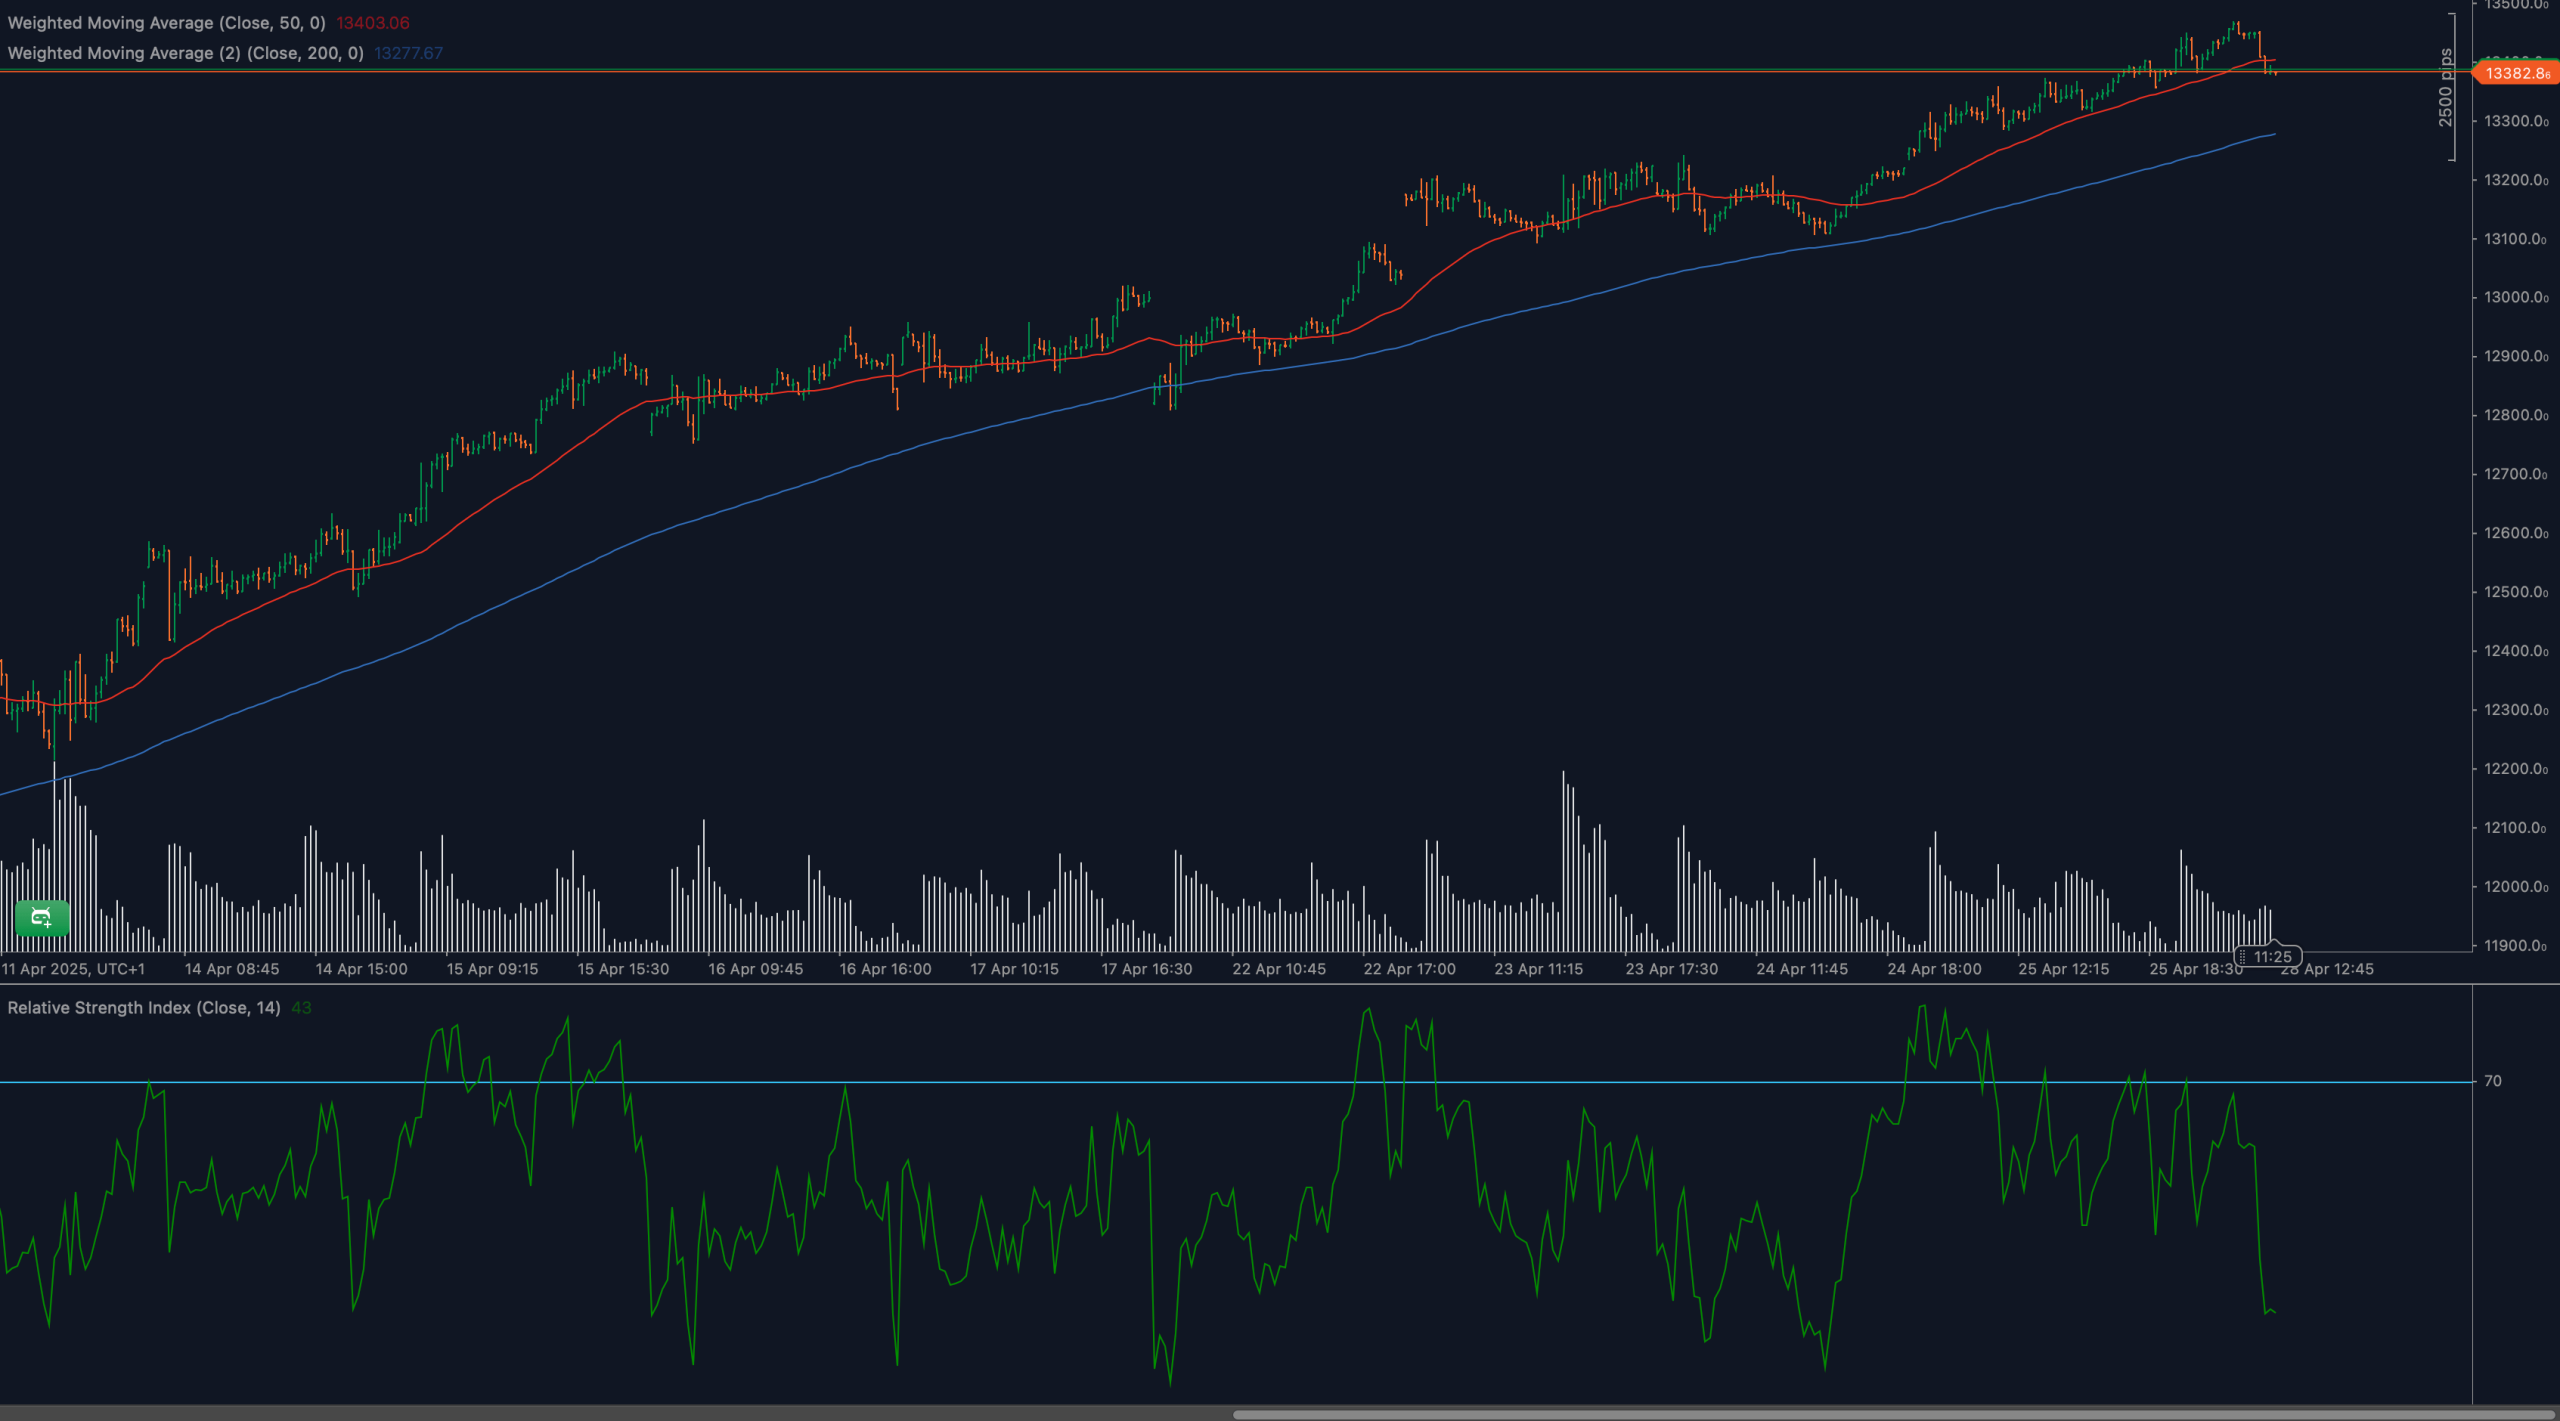
ESP35 (Spanish IBEX 35 Index) has pulled back to retest the 13,382 support after a strong and extended bullish run. After weeks of consecutive gains, momentum is showing signs of cooling, as visible from the RSI drop and declining volume.
Despite the pullback, the structure remains broadly bullish for now — price is still trading above both major moving averages. However, the zone around 13,382 is crucial: a sustained bounce could resume the uptrend, while a breakdown could open a deeper corrective phase.
📈 TECHNICAL ANALYSIS
What Are the Key Support and Resistance Levels for ESP35?
Key support is at 13,382, aligning with recent breakout structure and minor Fibonacci retracement. Below that, stronger support is found at 13,200 and 13,000. Resistance remains at 13,520, the recent rally high. A move back above 13,450would favor bulls regaining control.
Moving Average Analysis and Dynamic Price Levels
ESP35 holds above both the 50-period WMA (13,403) and the 200-period WMA (13,277). These moving averages are trending higher, supporting the bullish medium-term picture. The 50-WMA in particular is providing immediate dynamic support and will be key for maintaining trend structure.
RSI Momentum Analysis and Divergence Patterns
The 14-period RSI has fallen sharply to 43, signaling weakening bullish momentum. RSI previously hovered in the overbought zone but has now dropped below the midline, favoring bears. No obvious divergence is present, but this loss of momentum after extended overbought conditions often precedes deeper pullbacks if support fails.
Price Action and Candlestick Analysis
Recent candlestick formations show increased volatility and larger wicks, suggesting buyer-seller battles near current levels. A bullish reversal pattern forming above 13,382 would favor a recovery. Conversely, strong bearish closes below 13,380 would confirm that bears are gaining ground.
Chart Patterns and Formation Analysis
ESP35 could be developing a rising wedge breakdown, with price narrowing and now breaking slightly below the lower boundary. This pattern typically resolves bearish unless buyers quickly reclaim higher ground. The next 1–2 sessions will be critical for validating this breakdown or invalidating it with a strong bounce.
Fibonacci Retracement Levels and Extension Targets
Measuring from the rally swing low near 12,800 to the high around 13,520, the 23.6% Fibonacci retracement aligns near 13,380 — the current test zone. The 38.2% retracement is at 13,240, matching with the next significant horizontal support. Downside extension targets, if selling accelerates, would project toward 13,000.
🔍 MARKET OUTLOOK & TRADING SCENARIOS
Bullish Scenario for ESP35
A strong bullish reversal above 13,382, with RSI recovering above 50, would signal that buyers are defending the trend. Upside targets would then be 13,450 and 13,520. A clean close above the 50-WMA would confirm strength.
Neutral Scenario for ESP35
If price oscillates between 13,300–13,450, expect range trading. RSI between 45–55 and mixed candles would support a sideways view. Traders could look for mean reversion strategies until breakout signals emerge.
Bearish Scenario for ESP35
A decisive breakdown below 13,382, confirmed by volume expansion and RSI falling toward 40 or lower, would open downside toward 13,240 and 13,000. This would mark a structural shift to a corrective phase.
💼 TRADING CONSIDERATIONS
For bullish setups, traders should watch for stabilization and bullish candles above 13,382. Long positions could target 13,450 and 13,520, with stops under 13,300 to protect against downside risk.
For bearish setups, entries can be considered on breakdowns below 13,380, aiming for targets at 13,240 and 13,000, with stops placed just above 13,400.
🏁 CONCLUSION
ESP35 is at a crucial crossroads, testing major support at 13,382 after an extended bullish run. With RSI weakening and momentum cooling, the next move from this level will define whether the uptrend resumes or a deeper correction unfolds. Traders should closely monitor for breakout or breakdown confirmation over the coming sessions.
⚠️ DISCLAIMER
This analysis is for informational purposes only and does not constitute investment advice. All trading involves significant risk. Always consult with a licensed financial advisor before making trading decisions.


