
📊 MARKET OVERVIEW
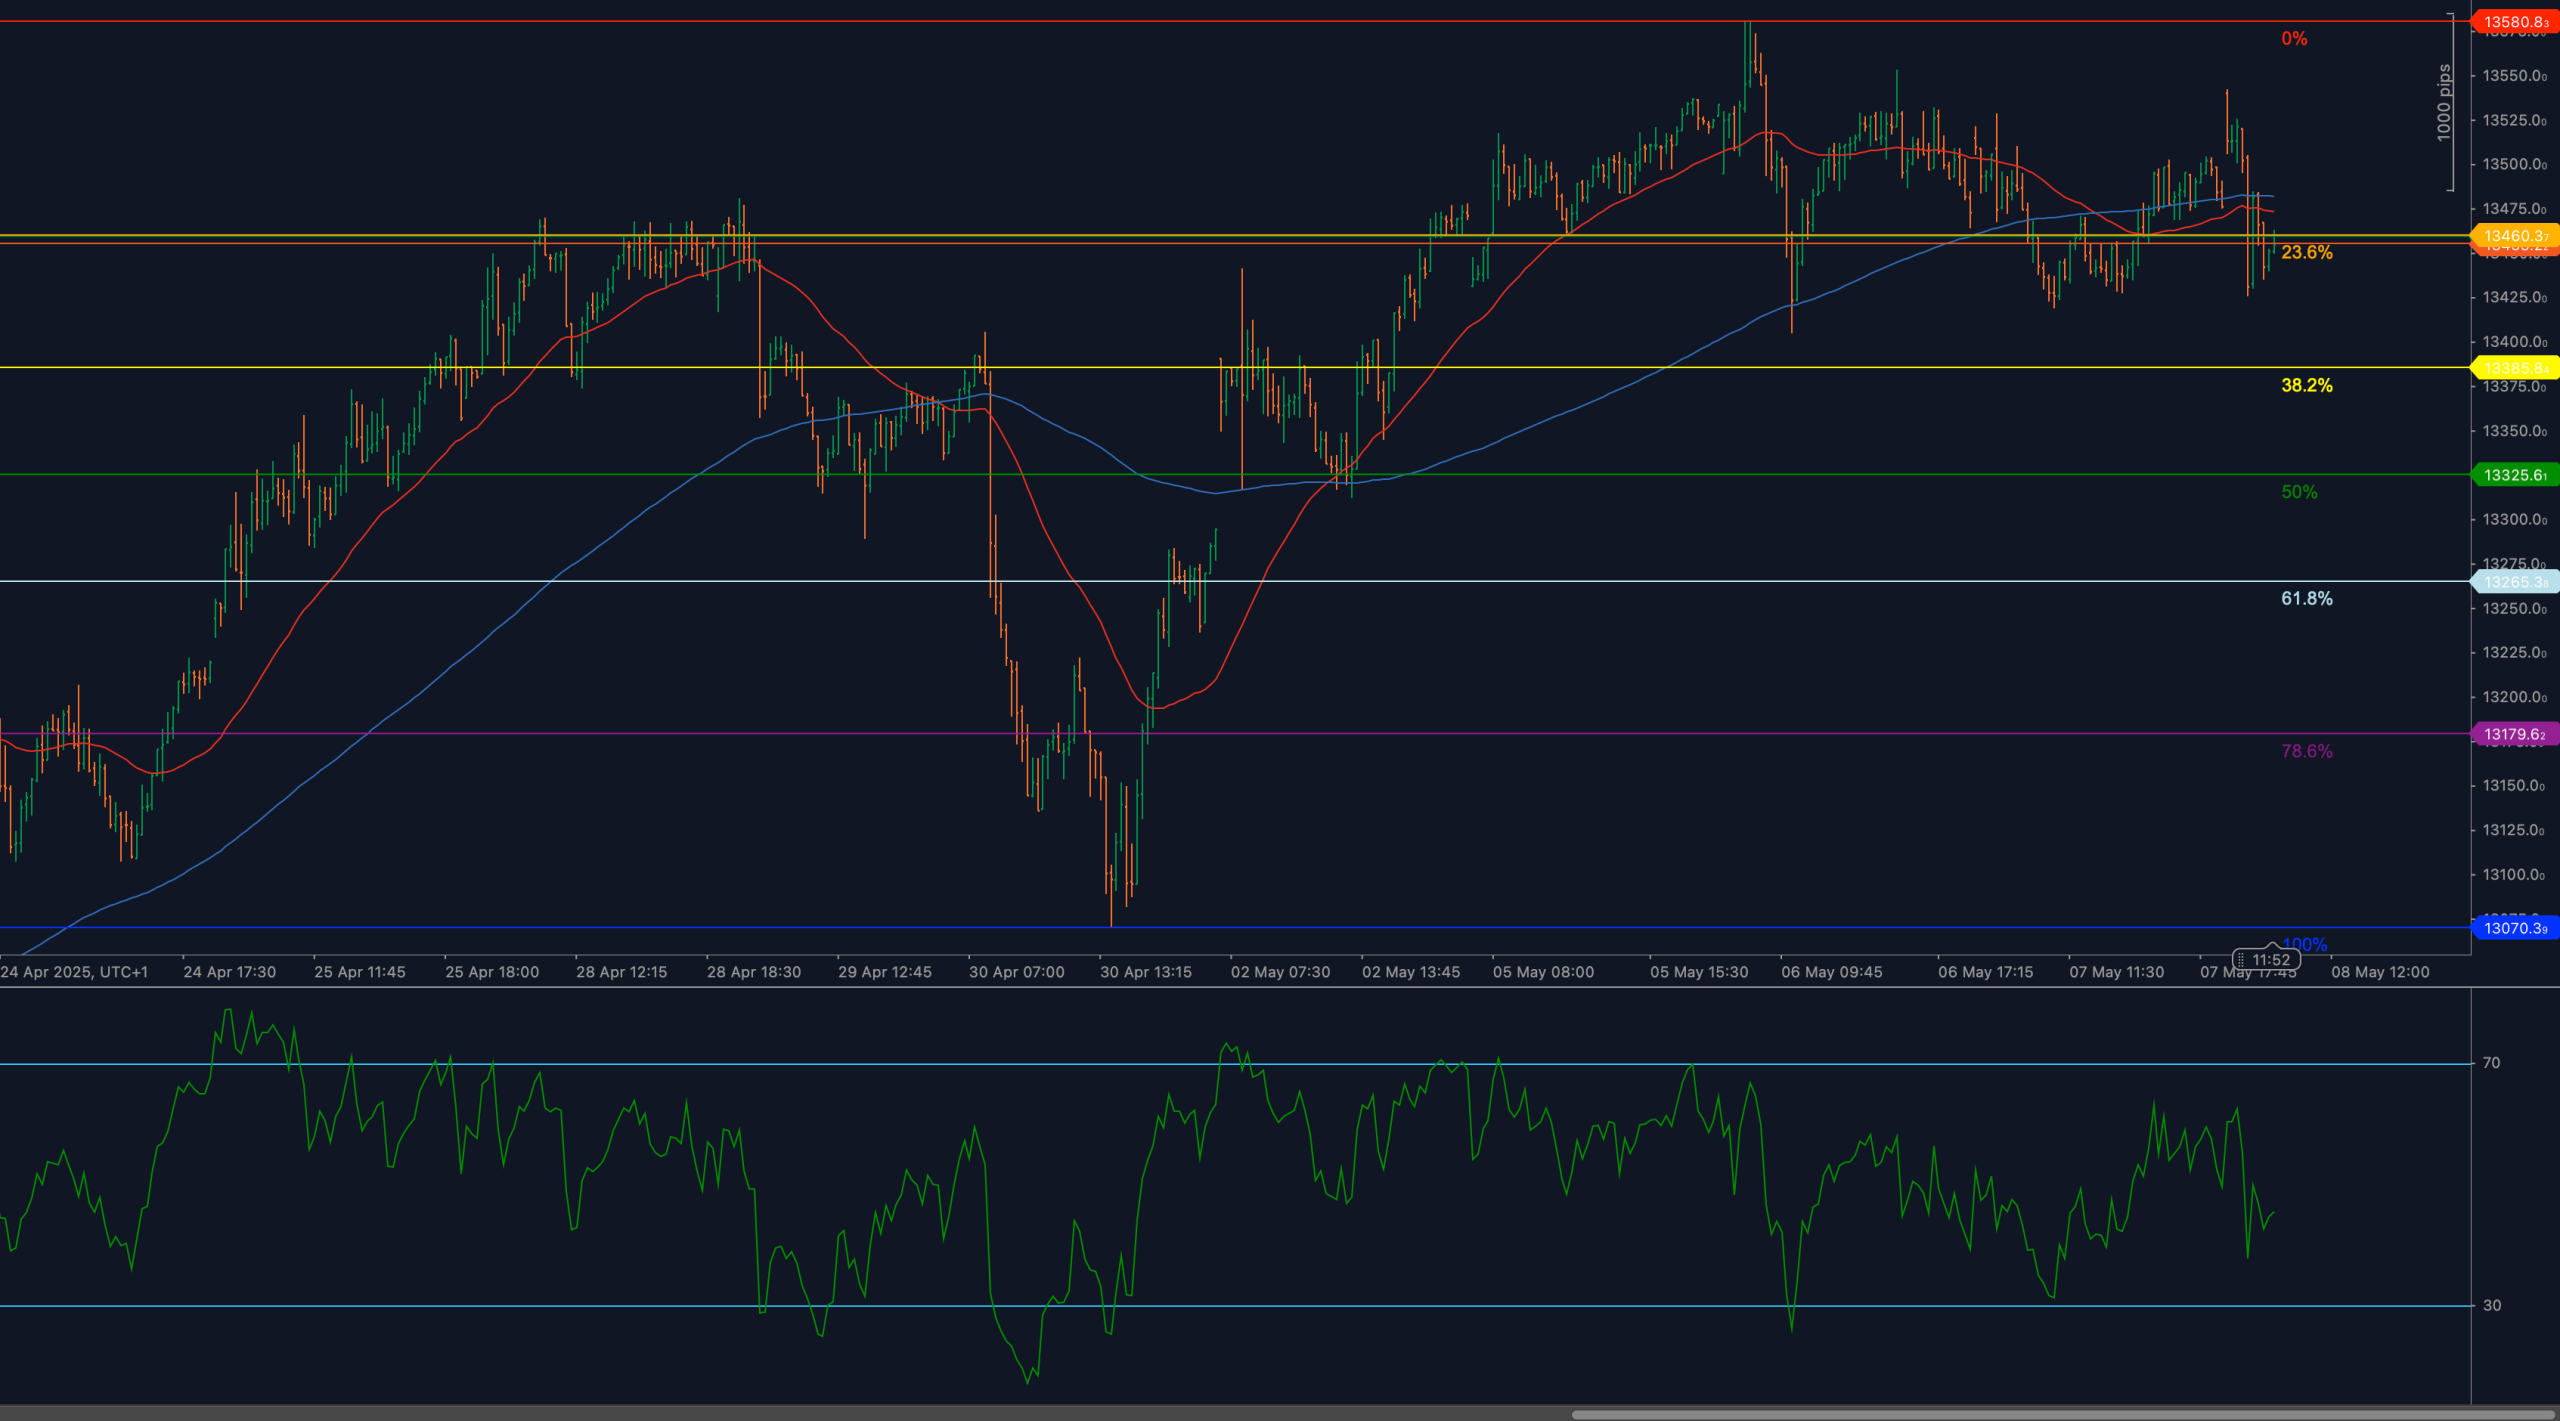
The IBEX 35 Futures (ESP35) has retraced lower after a short-lived attempt to hold above the 23.6% Fibonacci retracement at 13460.3, calculated from the April 30 low at 13070.3 to the May 6 high at 13580.8. Price has failed to maintain elevation and is now consolidating just above this level, with both moving averages flattening and the RSI showing early signs of rollover. The pullback follows an earlier recovery leg that now appears to be losing steam.
Broad European indices are experiencing rotational pauses as traders reassess upside potential. For ESP35, the inability to sustain above the retracement zone introduces risk of further weakness, especially as momentum indicators flatten and no clear bullish continuation pattern emerges.
📈 TECHNICAL ANALYSIS
Key Support and Resistance Levels
The immediate resistance zone is defined by 13460.3, the 23.6% Fibonacci retracement, which has now acted as both support and rejection in recent sessions. A clean breakout above this level is required to reestablish directional bias toward the 13580.8 high. On the downside, 13356.5, corresponding to the 38.2% retracement, becomes the next level of interest if price fails to hold current structure. Below that, 13275.6, the 61.8% retracement, and 13179.6, the 78.6% level, come into play if bearish momentum accelerates.
Moving Averages and Dynamic Price Action
ESP35 is currently caught between the 50-period WMA and the 200-period WMA, both of which are beginning to flatten. The lack of slope indicates a temporary loss of directional strength, and the failure to stay above the 50-WMA adds weight to short-term bearish pressure. If price closes below both moving averages, structure will favor reversion toward deeper Fibonacci supports. A return above 13460 would be needed to reassert control by the bulls.
RSI Momentum and Bearish Pressure
The 14-period RSI has lost altitude after peaking near 65 and is now rolling lower toward the 50 neutral line. This shift in slope confirms the loss of upward momentum. There is no divergence yet, but if RSI breaks below 45, it would validate the idea of near-term corrective movement. A rebound and hold above 60 would be required to support any new bullish impulse.
Candlestick Behavior and Price Action Clarity
Recent candlesticks have shown indecision followed by rejection, with lower highs and weaker closes around the 13460 mark. No bullish engulfing or reversal structures have formed, and the latest candles reflect bearish control as price fails to defend minor intraday support zones. If the current sequence continues, pressure will likely increase toward 13356.5, where bulls will need to show clear response.
Chart Structure and Breakdown Formation
The chart structure shows a potential right shoulder or distribution zone after failing to make new highs beyond 13580.8. The inability to hold the breakout above 13460 leaves price vulnerable to a drift lower within a corrective channel. Unless bulls reclaim structure quickly, the setup favors a gradual descent into deeper retracement levels.
Fibonacci Retracement and Extension Levels
The Fibonacci structure drawn from 13070.3 to 13580.8 offers a clear sequence of technical support zones. The 23.6% retracement at 13460.3 was breached and has failed to hold as support. The 38.2% level at 13356.5 now represents the next technical target, with the 50% retracement at 13325.6 and 61.8% at 13275.6 layered below. If pressure continues, price could drift as far as the 78.6% retracement at 13179.6, or even revisit the 13070.3 swing low. Only a strong bullish recovery above 13460 would invalidate the retracement sequence.
🔍 MARKET OUTLOOK & TRADING SCENARIOS
Bullish Scenario
If price holds above current levels and reclaims 13460, a bullish recovery toward 13580.8 becomes viable. RSI would need to turn higher and reenter the 60+ zone to validate momentum, with strong candle closes above moving averages as confirmation.
Neutral Scenario
Sideways trade between 13356 and 13460 defines a temporary range as RSI stabilizes near 50 and moving averages remain flat. This range-bound behavior would delay trend resolution and suggest indecision.
Bearish Scenario
A confirmed break below 13356.5, with RSI slipping under 45 and price closing below the 200-WMA, would expose downside targets at 13325 and 13275, potentially extending to 13179 if momentum accelerates. This would confirm the beginning of a deeper corrective phase.
💼 TRADING CONSIDERATIONS
Bulls will want to see price reclaim and hold above 13460 before committing to breakout setups. Bears may look for entries on confirmed rejection candles below that level, with downside targets staged at each Fibonacci retracement. Range traders can consider fade strategies within the 13460–13356 band, but only until momentum breaks out.
🏁 CONCLUSION
ESP35 has failed to hold above the 23.6% Fibonacci retracement at 13460.3, and now risks deeper correction toward 13356.5 and below. Momentum is fading, structure is neutral at best, and price is caught between flat moving averages. Traders now watch for breakout reclaim or clean breakdown as the next directional catalyst.
⚠️ DISCLAIMER
This analysis is for informational purposes only and does not constitute financial advice. Always consult with a licensed financial professional before making trading decisions.


