
📊 MARKET OVERVIEW
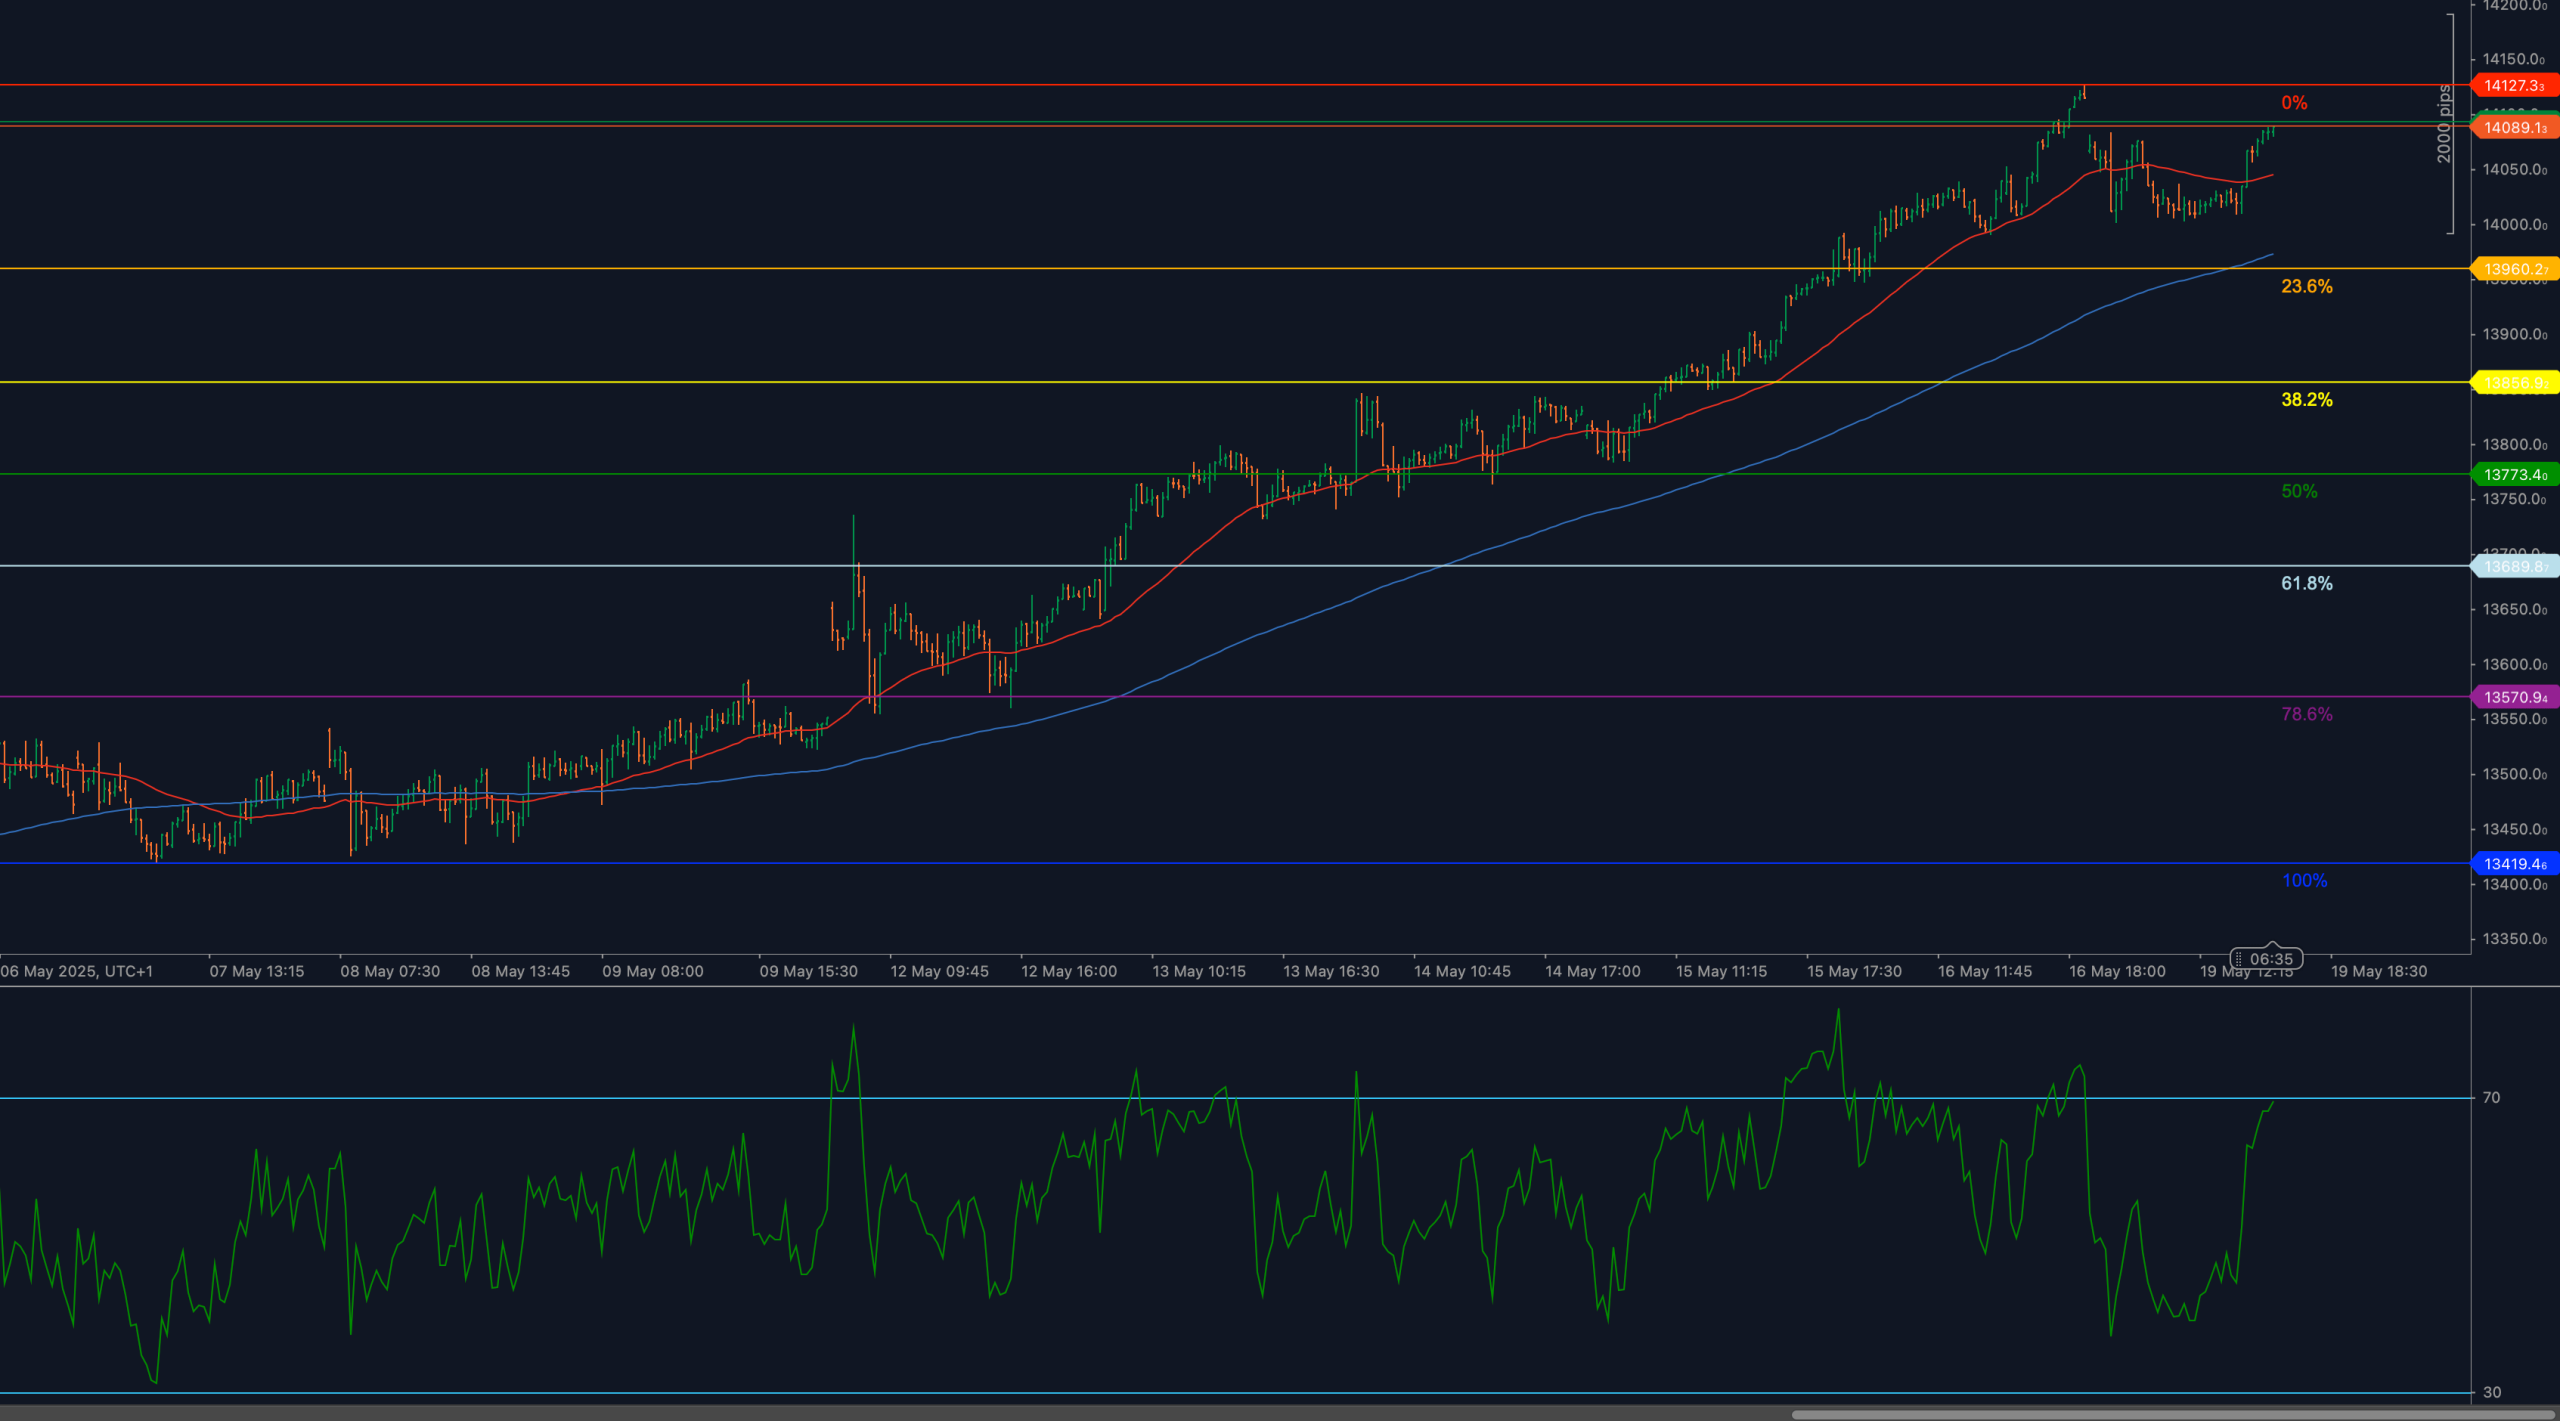
ESP35 has returned to test the resistance area near 14,089, following a steady rally from the May 13 corrective low around 13,960. The bullish trend remains structurally intact, with price maintaining elevation above both key moving averages. Recent momentum has been driven by strength in European equities and technical follow-through after the clean bounce from the 23.6% Fibonacci retracement.
While the index has not yet reclaimed the 14,127 high, the current price action suggests bulls are preparing for another attempt. RSI is pushing toward 70, confirming renewed strength, although slightly overextended conditions could produce a near-term stall. A decisive breakout above 14,127 would resume the broader advance, while rejection here could open a window for rotation or consolidation.
📈 TECHNICAL ANALYSIS
Key Support and Resistance Levels
The immediate resistance is located at 14,127, which marks the current swing high and defines the upper boundary of this impulsive leg. A breakout above this level would confirm trend extension and open the door toward higher projections around 14,200–14,270.
To the downside, first support rests at 13,960, the 23.6% Fibonacci retracement of the current rally. A clean break below this level would expose the 38.2% retracement at 13,772, followed by the 50% mark at 13,675. These levels would become active should bulls fail to break higher and momentum begins to unwind into a pullback phase.
Moving Averages and Dynamic Price Action
Price continues to trade comfortably above both the 50-period and 200-period weighted moving averages, reinforcing the bullish structure. The 50-WMA is sloping upward and is currently tracking closely to the 14,000–14,020 area. The 200-WMA, sitting below near 13,750, remains a secondary but important dynamic support level in the event of a deeper retracement.
As long as price remains above the 50-WMA, the structure favors bullish continuation. A loss of this level would begin to weaken the short-term setup, though the broader trend would not be threatened unless the 200-WMA is breached.
RSI Momentum and Bullish Pressure
The 14-period RSI has pushed back toward the upper boundary near 70, reflecting renewed bullish energy. Momentum readings suggest that the market remains in trending mode, but the indicator is approaching overbought territory. If RSI fails to break through 70 and begins to roll over, this would signal the need for a breather before continuation.
However, if RSI clears 70 on a breakout above 14,127, this would confirm a fresh impulse leg and align with trend extension into higher targets. A move below 60 would be the first warning sign of momentum loss.
Candlestick Behavior and Price Action Clarity
Recent candles reflect healthy bullish structure, with shallow pullbacks and consecutive higher closes. The recent rejection near 14,127 produced no major reversal signal — instead, price consolidated above prior resistance and formed a tight range that now serves as a potential launchpad.
No bearish engulfing or high-volume selling has emerged. Bulls remain in control for now, but a false breakout above 14,127 followed by sharp rejection would be a pattern to watch for tactical repositioning.
Chart Structure and Breakout Formation
The chart structure maintains a clear bullish trajectory, with a series of higher lows and higher highs extending from early May. After holding the 13,960 retracement zone, price resumed its upward march toward the prior high.
The current formation resembles a bullish continuation wedge, with compression below the breakout level. A sustained move above 14,127 would confirm resolution of this wedge and validate the broader upside breakout scenario. If price fails to break higher, short-term sellers may begin targeting lower Fib levels.
Fibonacci Retracement and Extension Levels
The Fibonacci retracement drawn from 13,419 (May 6 low) to 14,127 (May 17 high) defines the active pullback structure. Price briefly tested support last week and rebounded from the 23.6% retracement at 13,960, which remains the first area to watch in the event of renewed weakness. A break below this level would expose the 38.2% retracement at 13,772, which typically serves as a deeper correction zone in trending markets. Further downside would put pressure on the 50% level at 13,675, and any sustained break here could shift focus to the 61.8% retracement at 13,586, a critical boundary between pullback and broader structural reversal. If bearish momentum accelerates beyond that, the 78.6% retracement at 13,570 may act as last support before full trend invalidation, which would occur on a return to the 13,419 origin point of the move. On the upside, if price successfully breaks above 14,127, the move would resume into Fibonacci extension territory, with projections near 14,230 and 14,270 becoming the next potential resistance zones.
🔍 MARKET OUTLOOK & TRADING SCENARIOS
Bullish Scenario
A break and close above 14,127, supported by RSI exceeding 70, would confirm bullish continuation and initiate an advance toward 14,230–14,270. Structure, moving averages and momentum all currently favor this scenario.
Neutral Scenario
If price remains capped below 14,127 while holding above 13,960, a consolidation zone may form. RSI fluctuating between 60–68 would support a sideways pause before the next directional break.
Bearish Scenario
A rejection from 14,127, followed by a break below 13,960, would activate downside targets at 13,772, 13,675, and possibly 13,586. This path would require RSI losing the 60 zone, confirming broader exhaustion.
💼 TRADING CONSIDERATIONS
Bullish entries may be considered on breakout above 14,127 with confirmation from RSI >70. Longs from the 13,960zone remain valid while structure holds. Bears may look to engage on failed breakout attempts or rejection candles near highs, targeting the 13,770s or 13,600s depending on signal strength.
🏁 CONCLUSION
ESP35 is once again approaching its recent high at 14,127, with price structure, RSI and moving averages aligned in bullish fashion. Unless the breakout attempt fails, the path of least resistance remains higher, targeting 14,230+. Traders should monitor RSI and price reaction near highs to confirm follow-through or fading strength.
⚠️ DISCLAIMER
This analysis is for informational purposes only and does not constitute financial advice. Always consult with a licensed financial professional before making trading decisions.


