
📊 MARKET OVERVIEW
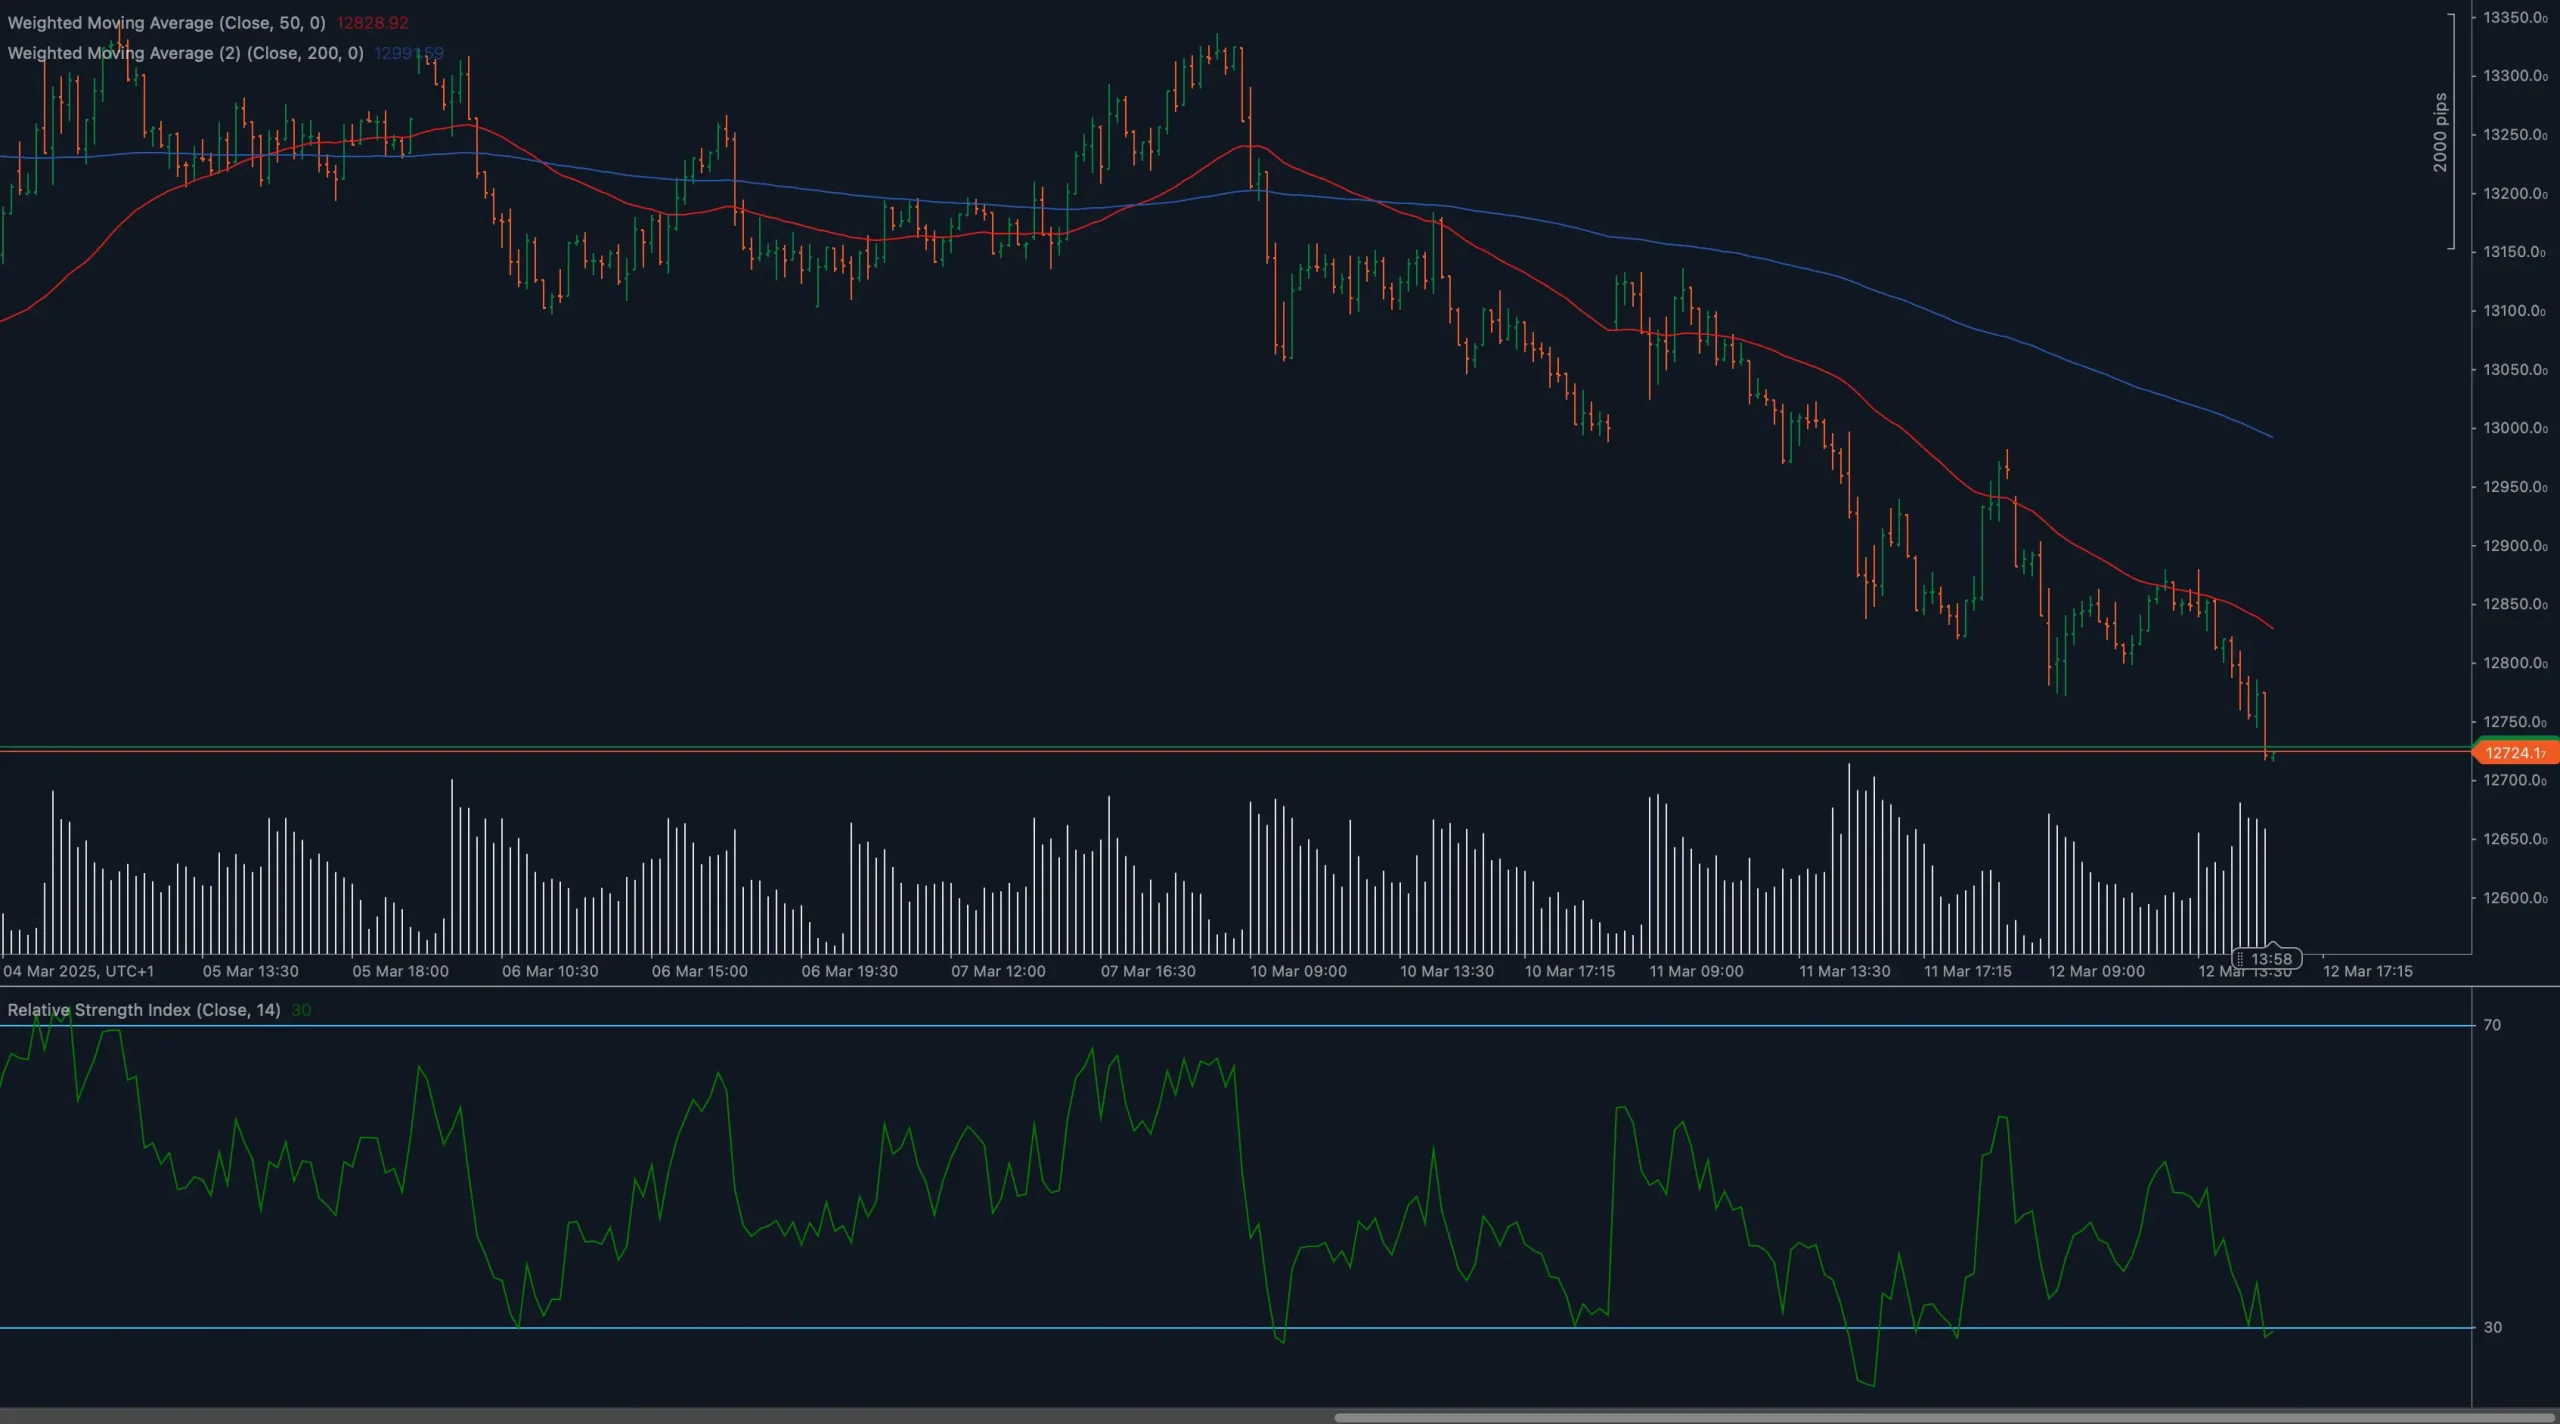
The ESP35 index has been exhibiting a clear bearish trend over the analyzed period, with prices consistently trading below both the 50-day and 200-day moving averages. Currently hovering around the 12750 support level, the index has experienced significant downward momentum, forming a series of lower highs and lower lows. Volume patterns show increased participation during selling phases, reinforcing the bearish sentiment that has been dominating the market landscape in recent trading sessions.
📈 TECHNICAL ANALYSIS
What Are the Key Support and Resistance Levels for ESP35?
ESP35 is currently testing a critical support zone around 12750, which represents a significant technical level that buyers may attempt to defend. This level gains additional importance as it aligns with previous structural lows. If breached, the next substantial support would likely emerge around 12650, followed by the psychological 12500 level. On the resistance side, immediate hurdles are positioned at 12850 (recent reaction high), followed by the more significant barriers at 13000 and the declining 50-day moving average currently situated near 13150.
Moving Average Analysis and Dynamic Price Levels
The price action in ESP35 is clearly positioned below both the 50-day moving average (red line) and the 200-day moving average (blue line), confirming the bearish trend’s dominance. The 50-day MA is sloping downward and positioned below the 200-day MA, creating a classic “death cross” formation that typically signals sustained bearish momentum. The current separation between price and these moving averages suggests strong downward momentum, with the 50-day MA now functioning as dynamic resistance around the 13150 region.
RSI Momentum Analysis and Divergence Patterns
The 14-period Relative Strength Index (RSI) is currently hovering near the 30 level, approaching oversold territory. While this might suggest potential exhaustion in the selling pressure, no significant bullish divergence has formed yet. The RSI has been making lower lows in line with price action, confirming the bearish momentum. Traders should monitor for potential divergence patterns where the RSI forms higher lows while price continues lower, which could signal a possible momentum shift.
Price Action and Candlestick Analysis
Recent candlestick formations show consistent bearish pressure with longer red (bearish) candles dominating the chart, particularly in the last week of trading. Buyers’ attempts to push prices higher have been met with renewed selling, resulting in several bearish engulfing patterns that have maintained the downward trajectory. The lack of substantial bullish reversal candles suggests bears remain firmly in control, with limited evidence of exhaustion in the recent price action.
Chart Patterns and Formation Analysis
ESP35 appears to be forming a descending channel pattern, with prices consistently respecting the upper and lower boundaries of this bearish formation. The measured move target for this pattern suggests potential continuation toward the 12500 level if the current support fails to hold. Additionally, the series of lower highs and lower lows confirms the bearish trend structure, with no signs of pattern invalidation thus far. Traders should monitor for any breakout from this channel, as it would signal a potential shift in market sentiment.
Fibonacci Retracement Levels and Extension Targets
Using the recent swing high to swing low Fibonacci retracement, the 38.2% level aligns closely with the 13000 resistance, while the 50% retracement coincides with the 50-day moving average around 13150. These overlapping technical levels create significant resistance zones that bulls would need to overcome to invalidate the bearish scenario. On the downside, Fibonacci extension levels suggest potential targets at 12650 (127.2% extension) and 12500 (161.8% extension) if current support fails.
🔍 MARKET OUTLOOK & TRADING SCENARIOS
Bullish Scenario for ESP35
For a bullish reversal to materialize, ESP35 would need to first defend the current 12750 support level decisively. A subsequent move above 12850 would be the initial requirement, followed by clearing the psychologically important 13000 level. The key confirmation would come from pushing above the declining 50-day moving average around 13150, which would signal a potential trend shift. This scenario would likely be accompanied by the RSI moving back above 50 and increased buying volume. Target levels in this case would be 13300 initially, followed by a test of the 200-day moving average.
Neutral Scenario for ESP35
A consolidation phase could develop if ESP35 stabilizes between 12750 support and 12850 resistance. This would represent a temporary equilibrium between buyers and sellers, possibly forming a base before the next directional move. The RSI would likely oscillate between 30-50 in this scenario, indicating reduced momentum. Traders might consider range-bound strategies between these levels while waiting for a clearer directional signal. The duration of such consolidation would provide clues about the strength of the preceding downtrend.
Bearish Scenario for ESP35
The bearish scenario, which currently has higher probability given the established trend, would see ESP35 breaking below the 12750 support level. This would likely accelerate selling pressure toward the 12650 target initially, with potential for extension toward 12500 if bearish momentum intensifies. The RSI would potentially reach deeply oversold levels below 30, though sustained readings in this zone would also increase the likelihood of an eventual technical bounce. This scenario would be confirmed by increasing volume on downside moves and continued rejection at resistance levels.
💼 TRADING CONSIDERATIONS
When approaching the ESP35 index in the current market environment, risk management should take priority given the clear downtrend and elevated volatility. Bearish strategies such as selling rallies toward resistance levels (particularly near the 50-day MA) offer favorable risk-reward profiles, with protective stops placed above recent swing highs. For traders with a contrarian approach, potential long positions should only be considered with clear evidence of support at 12750, accompanied by positive RSI divergence and bullish reversal candlestick patterns.
Position sizing becomes particularly important in trending markets, with smaller position sizes recommended given the higher volatility environment. The current Average True Range (ATR) suggests using wider stops than normal to avoid premature exit due to market noise. For swing traders, the key decision points remain the 12750 support and 13000 resistance levels, which represent significant technical thresholds where price reaction should provide valuable information about the next directional move in ESP35.
🏁 CONCLUSION
The ESP35 index displays a firmly bearish technical structure, trading below significant moving averages with consistent downward momentum. The critical support at 12750 represents a key battleground that will likely determine the short-term direction. While oversold conditions suggest potential for a technical bounce, the overall trend remains bearish until price action demonstrates a clear shift in structure by breaking above key resistance levels and the declining moving averages. Traders should remain vigilant around the outlined support and resistance zones, as these represent the most probable areas for significant price reactions in the coming trading sessions.
⚠️ DISCLAIMER
This technical analysis of ESP35 is provided for informational purposes only and does not constitute investment advice. Trading and investing in financial markets involve substantial risk of loss and may not be suitable for all investors. Past performance is not indicative of future results. Before making any investment decisions, you should conduct your own research and consult with a qualified financial advisor. The author and publisher assume no responsibility for any trading actions taken based on the information provided in this analysis.


