
📊 MARKET OVERVIEW
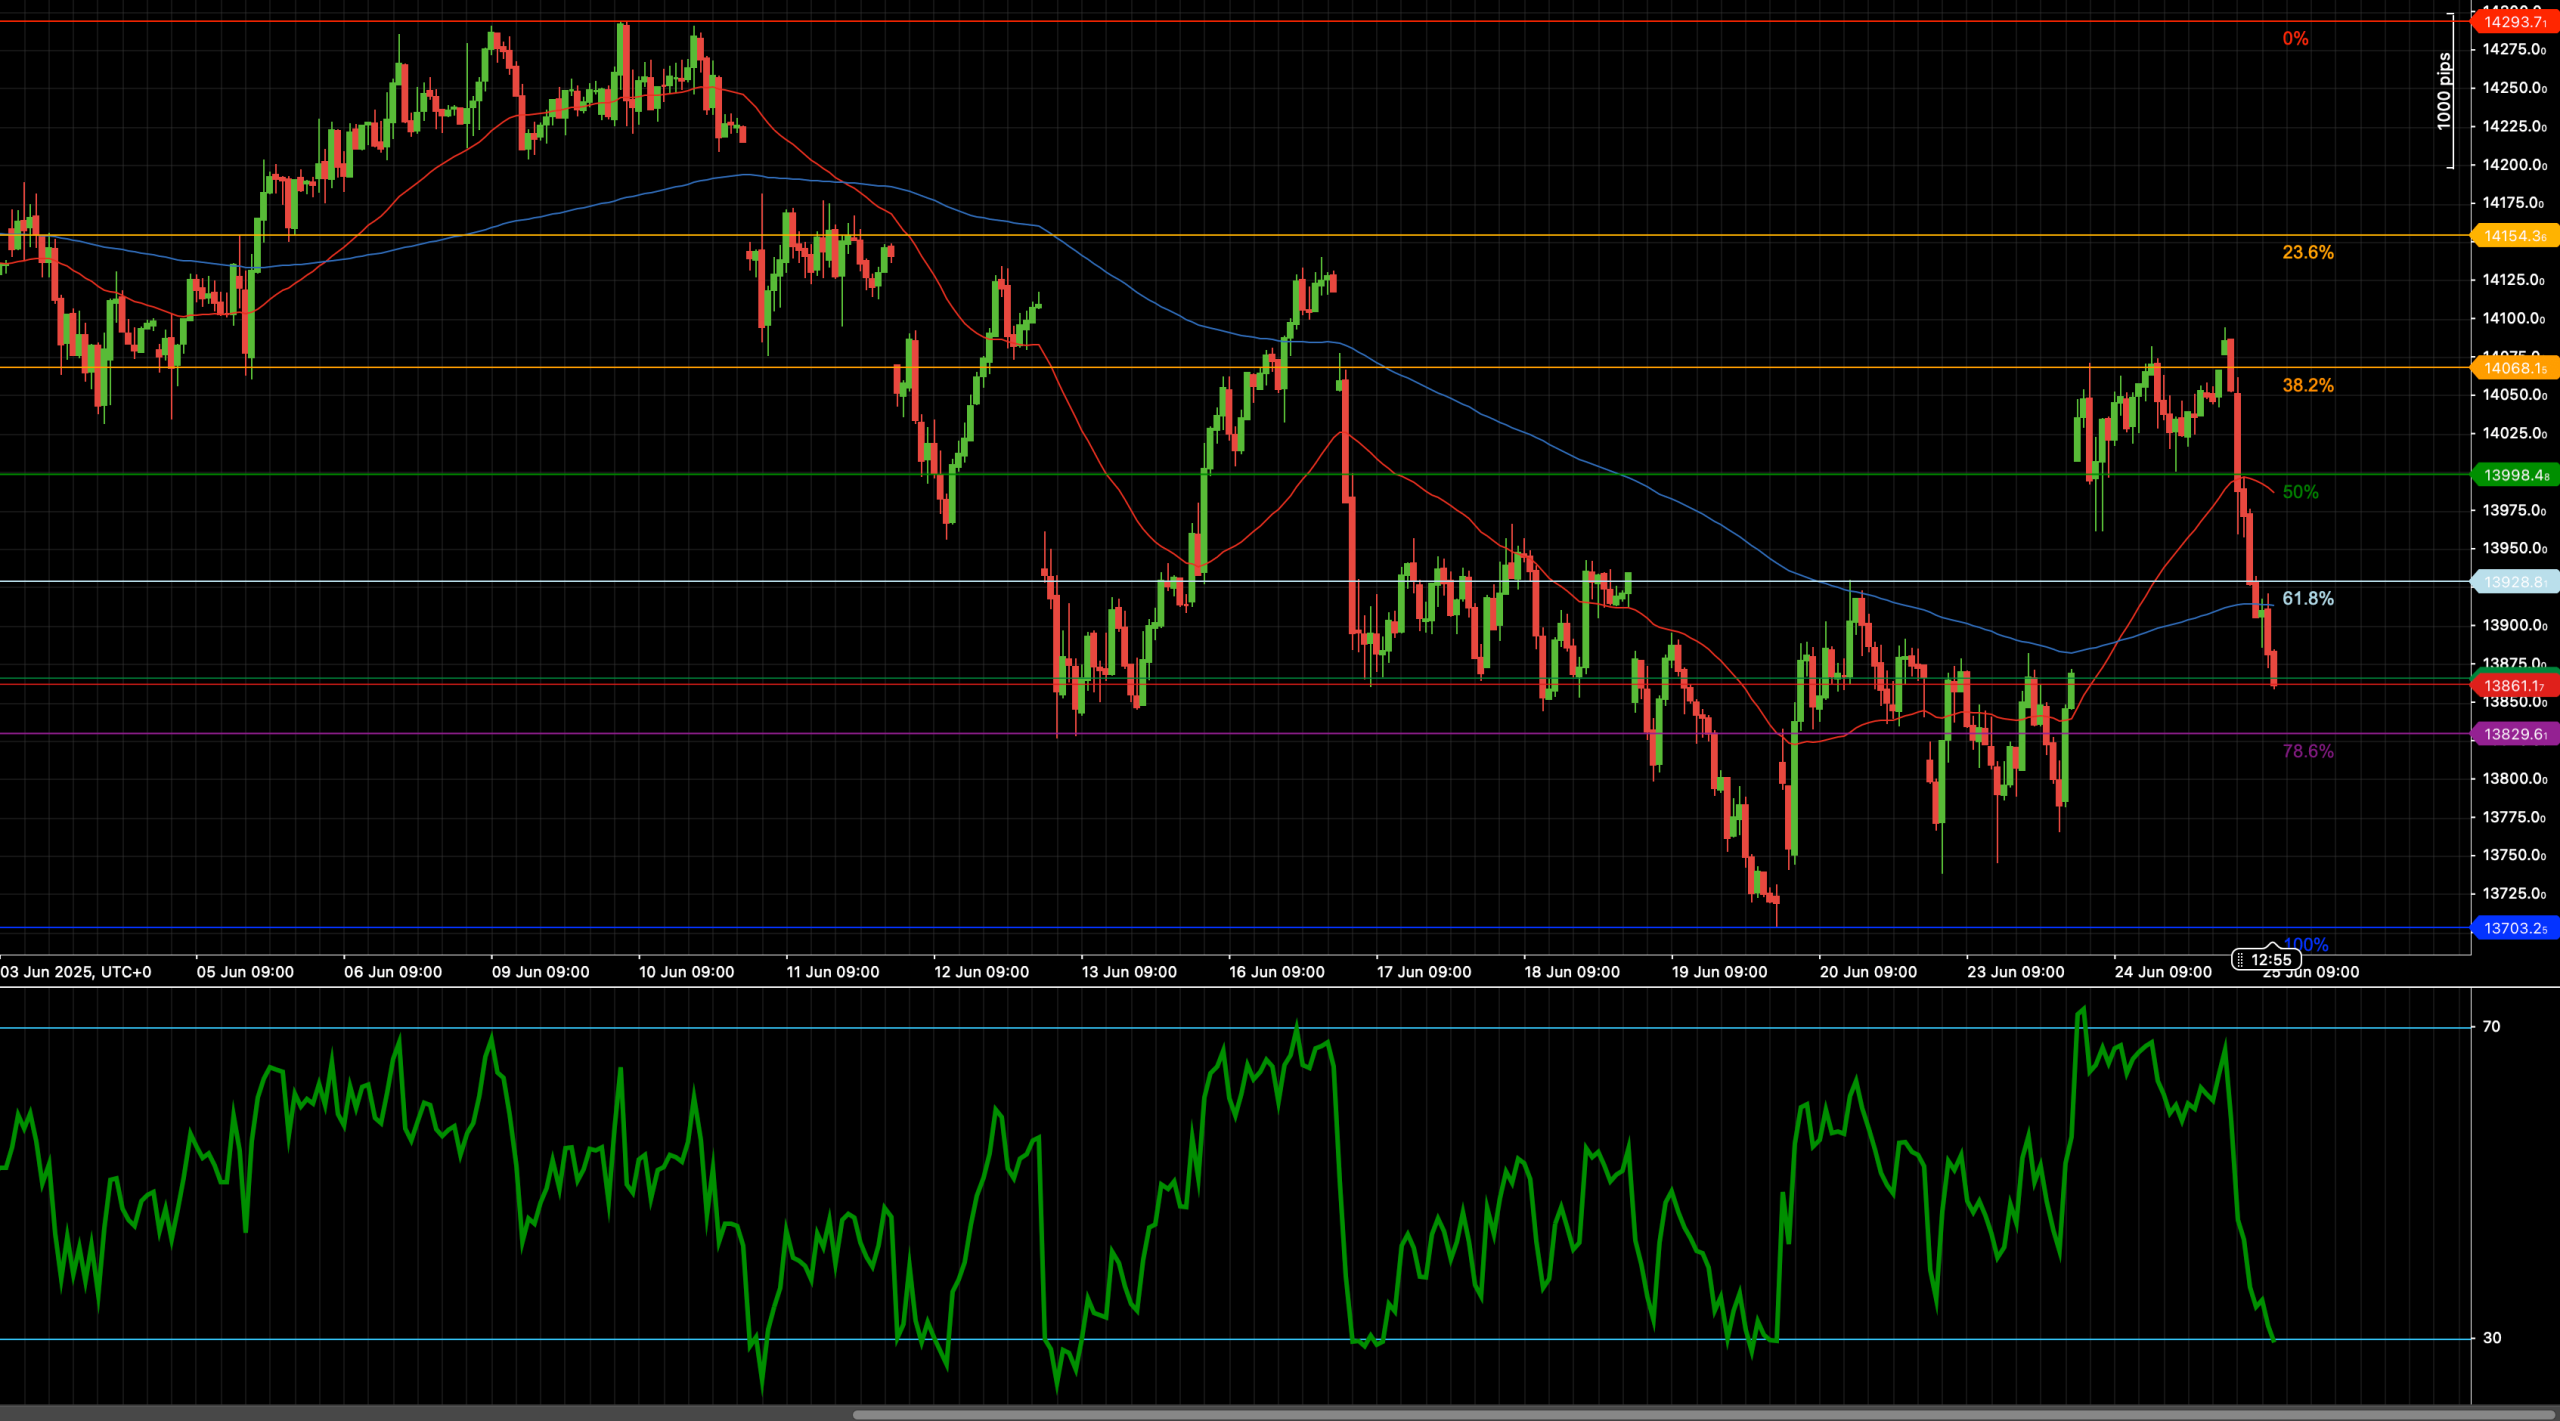
ESP35 has extended its recent bearish move, with price now breaking decisively below the 61.8% Fibonacci retracement at 13,887 — signaling growing downside momentum. The index has faced relentless selling pressure since rejecting the 14,080–14,125 resistance zone last week, and is now trading well below both its 50-period and 200-period weighted moving averages, reinforcing the bearish technical bias.
Momentum has clearly shifted in favor of the bears. The 14-period RSI has fallen sharply, now approaching oversold territory near 30, highlighting the intensity of the current selling wave. With price structure deteriorating and key support levels under threat, traders are closely watching for potential downside targets at 13,826 (78.6% Fib) and 13,703 (100% retracement).
Unless buyers can reclaim lost ground quickly, the path of least resistance remains to the downside. The coming sessions will be critical in assessing whether ESP35 stabilizes at current levels or continues its bearish slide.
📈 TECHNICAL ANALYSIS
Key Support and Resistance Levels
Immediate support is now in play at 13,826 (78.6% Fib) — the next key level to watch. Below this, the full retracement target at 13,703 would come into focus if the decline accelerates.
On the upside, initial resistance now sits at the broken 13,887 (61.8% Fib). Bulls would need to reclaim this level to ease immediate bearish pressure. Higher resistance zones appear at 13,975 (50%) and 14,080 (38.2%). Only a sustained recovery above 14,080 would materially shift the bias back toward neutral.
Moving Averages and Dynamic Price Action
ESP35 remains firmly below both the 50-period and 200-period weighted moving averages, which are now declining and acting as dynamic resistance. The 50-WMA near 13,975 and the 200-WMA above 14,000 will present stiff barriers for any bullish recovery attempt.
Until price reclaims at least the 50-WMA, any rallies should be viewed as corrective rather than a true trend change. The moving average structure clearly favors continued downside risk.
RSI Momentum and Bearish Pressure
The 14-period RSI has dropped aggressively, now approaching 30 — the threshold for oversold conditions. This signals that momentum is heavily tilted in favor of the bears. However, RSI in this zone also warns that a technical bounce could develop in the near term.
If RSI stabilizes and rebounds above 35–40, a short-covering rally could unfold. Conversely, a further breakdown with RSI firmly below 30 would reinforce bearish conviction and likely see downside extension.
Candlestick Behavior and Price Action Clarity
Recent candlesticks reflect strong selling pressure, with large-bodied red candles and minimal lower wicks — clear evidence of bearish control. The rejection from 14,080 was particularly aggressive, accelerating the current move lower.
Traders should watch for signs of exhaustion — such as long lower wicks or bullish reversal patterns — near 13,826. Without such signals, downside momentum is likely to persist.
Chart Structure and Breakdown Formation
Structurally, ESP35 remains in a clear downtrend, having formed lower highs and lower lows over the past two weeks. The break below 13,887 confirms the continuation of this bearish sequence.
Current action suggests a strong trend leg lower, with price momentum and RSI alignment supporting further weakness unless bulls can reclaim key resistance zones. The descending structure remains dominant unless a reversal pattern develops soon.
Fibonacci Retracement and Extension Levels
The Fibonacci grid from 14,325 (swing high) to 13,703 (prior swing low) defines the active technical roadmap. With the break of 13,887 (61.8%), the market is now targeting the 78.6% retracement at 13,826, with further downside toward 13,703 if bearish momentum persists.
Any bullish rebound would need to clear 13,975 and 14,080 to shift the tone back to neutral. Until then, Fibonacci levels continue to align with the prevailing downtrend.
🔍 MARKET OUTLOOK & TRADING SCENARIOS
Bullish Scenario
A bounce from 13,826, with RSI rebounding above 35 and price reclaiming 13,887, could trigger a recovery toward 13,975 and possibly 14,080. This would require strong buying interest and clear reversal signals.
Neutral Scenario
Stabilization between 13,826–13,887, with RSI flattening near 35–40, could lead to range-bound consolidation, providing a pause in current downside momentum.
Bearish Scenario
A decisive breakdown below 13,826, with RSI breaking and holding below 30, would open the path for continued downside toward 13,703. This would confirm the bearish continuation.
💼 TRADING CONSIDERATIONS
Bullish setup: Look for bullish reversal signals near 13,826, with RSI above 35. Targets: 13,887, 13,975. Stops below 13,703.
Bearish setup: Short entries favored on breakdown below 13,826 or failed recovery of 13,887. Targets: 13,703. Stops above 13,887.
Risk context: RSI nearing oversold warns of potential bounce, but trend momentum remains bearish unless key resistance is reclaimed.
🏁 CONCLUSION
ESP35 remains under strong bearish control after breaking below the 61.8% Fibonacci level at 13,887. RSI is approaching oversold, but with moving averages in decline and price structure favoring the bears, risk remains tilted to the downside. Traders will closely monitor the reaction near 13,826, as a break below this level would likely extend the downtrend toward 13,703.
⚠️ DISCLAIMER
This analysis is for informational purposes only and does not constitute financial advice. Always consult with a licensed financial professional before making trading decisions.


