
📊 MARKET OVERVIEW
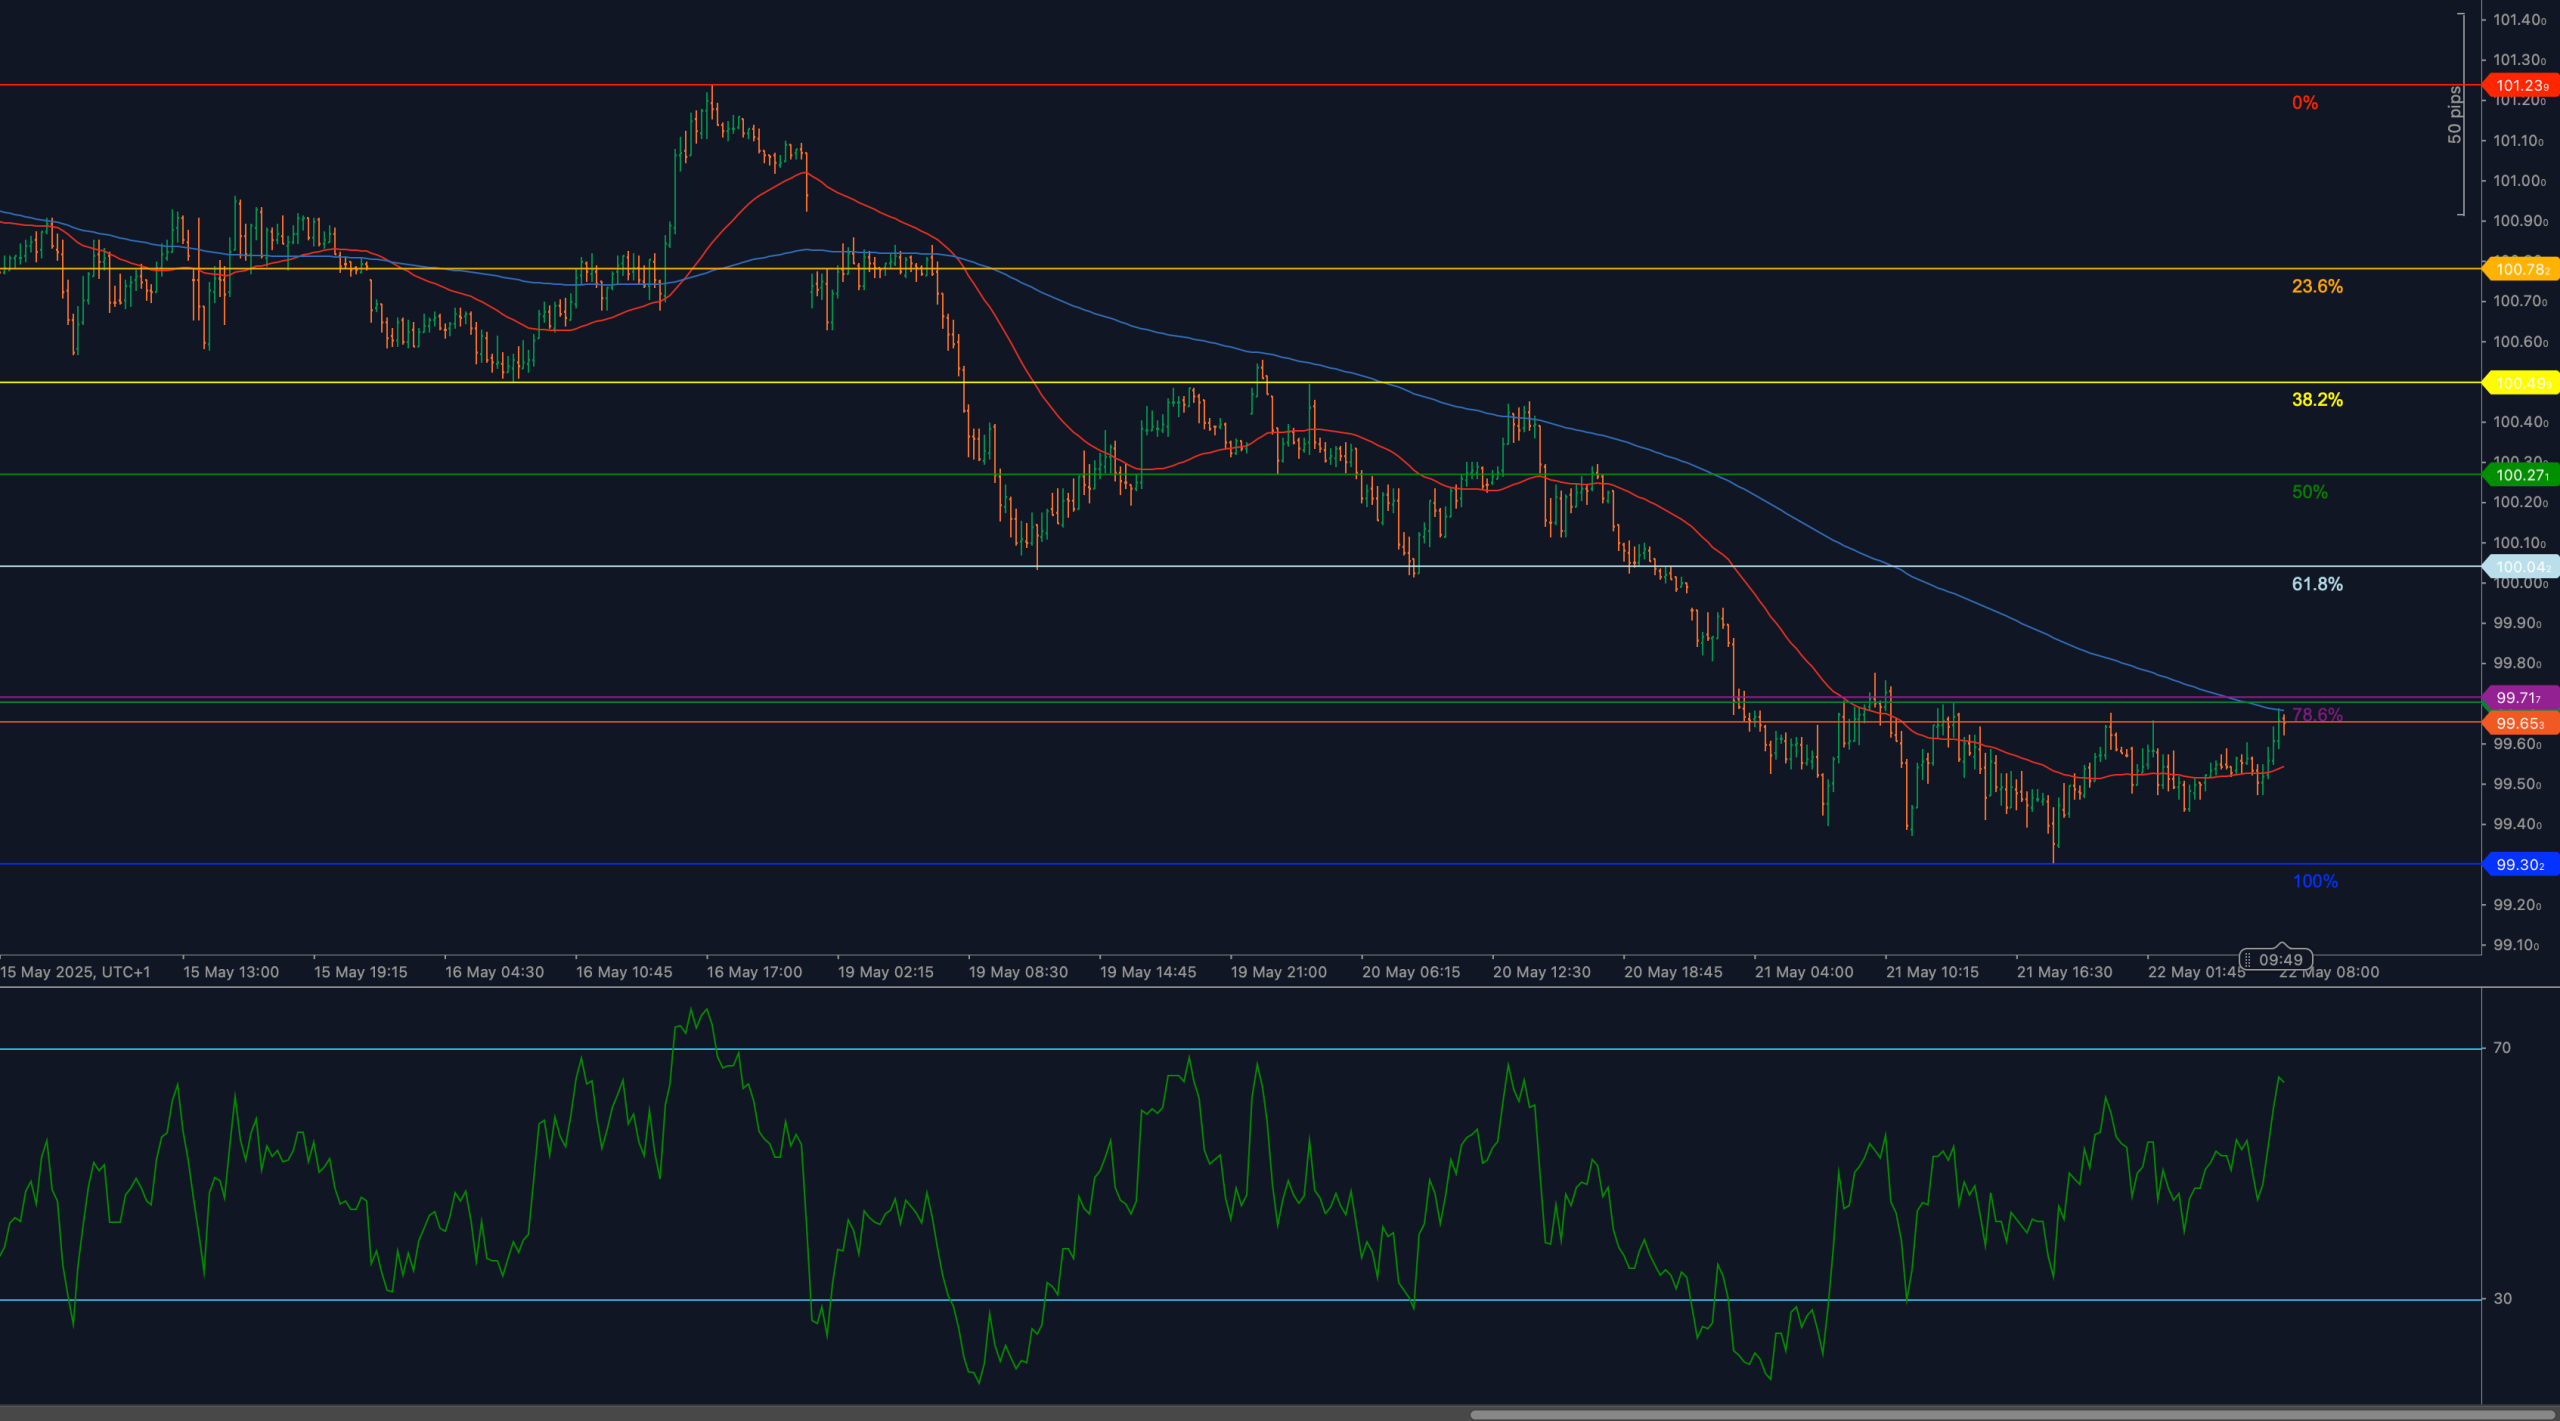
The US Dollar Index (DXY) has rebounded from recent lows, rising toward 99.71, where the 78.6% Fibonacci retracement of the May 16–22 downswing is located. The rally has lifted RSI sharply, but price action remains technically constrained below the 200-period weighted moving average, which continues to cap short-term momentum.
The broader backdrop reflects a cautious bid for the dollar amid uncertainty in equities and risk assets. However, unless price breaks above 99.71 and clears the 99.85–100.00 barrier, the bounce will remain corrective. Bulls are attempting to regain traction, but strong overhead structure may limit progress in the short term.
📈 TECHNICAL ANALYSIS
Key Support and Resistance Levels
The immediate resistance stands at 99.71, the 78.6% retracement, followed by 99.85 (swing pivot) and 100.00, a psychologically and technically important round number. A break above this zone would expose the 61.8% retracement at 100.15 and shift momentum in favor of a more decisive trend reversal.
Initial support lies at 99.65, followed by 99.30, the recent swing low. A move below this level would invalidate the current rebound and re-open the path toward 99.00–98.85, targeting deeper structure.
Moving Averages and Dynamic Price Action
DXY remains capped beneath the 200-period weighted moving average, which has acted as dynamic resistance since mid-May and is currently positioned just above 99.80. The 50-WMA is still below price, near 99.50, and may provide initial dynamic support on minor pullbacks.
Only a confirmed break and close above the 200-WMA would re-establish upward structure. Until then, rallies remain corrective and vulnerable to renewed selling.
RSI Momentum and Bullish Pressure
The 14-period RSI has rebounded strongly from oversold territory and is now testing levels just below 60, indicating renewed bullish momentum. However, the indicator has yet to break into trend-confirmation territory, and unless RSI clears 65, the move remains susceptible to a rollover.
If RSI rolls back below 50, downside momentum may return and test the conviction behind the current rebound.
Candlestick Behavior and Price Action Clarity
Recent candles show momentum candles lifting off the 99.30 base with decent range and closes near session highs. However, the current candle near 99.71 shows early signs of rejection — forming a small upper wick just beneath the resistance level.
Unless bulls print a strong bullish close above 99.71, the current bounce may lose steam. A clear rejection here would confirm the area as a structural ceiling.
Chart Structure and Breakdown Formation
The broader chart remains technically corrective following the sustained downtrend from 101.25 to 99.30. While the rebound has reclaimed some short-term structure, the price remains below both the 200-WMA and multiple swing highs.
The current structure resembles a bearish retracement leg, pressing into a key Fibonacci level without confirmation of reversal. Only a breakout above 100.00 would signal structural transition. Failure here could result in a resumed selloff.
Fibonacci Retracement and Extension Levels
The Fibonacci retracement drawn from 101.25 (May 16 high) to 99.30 (May 21 low) defines the active corrective structure. The bounce has tested the 78.6% retracement at 99.71, but failed to clear it. A confirmed breakout would target the 61.8% level at 100.15, followed by the 50% retracement at 100.40, and potentially the 38.2% level at 100.78, which also aligns with a prior consolidation cluster.
If price stalls here, downside targets return to 99.65, followed by 99.30. A loss of that level would reopen the full retracement to new lows. In case of bullish breakout, extensions above 100.78 could target 101.00–101.25, completing a full reversal of the leg.
🔍 MARKET OUTLOOK & TRADING SCENARIOS
Bullish Scenario
A close above 99.71, supported by RSI pushing through 65, would confirm trend recovery. Breakout targets include 100.15, 100.40, and possibly 100.78 if momentum builds.
Neutral Scenario
Consolidation between 99.65–99.71, with RSI stabilizing between 55–60, would suggest temporary indecision. Bulls would require breakout confirmation, while bears watch for rollover signs.
Bearish Scenario
A failure to break 99.71, followed by RSI dipping below 50, would expose 99.30 again. Breakdown below this level would resume the broader decline, targeting 99.00 and lower.
💼 TRADING CONSIDERATIONS
Bulls may look for breakout entries above 99.71, with confirmation from RSI and strong candle closes. Bears may remain active on rejection signals near resistance, targeting 99.30 and beyond if momentum fades.
🏁 CONCLUSION
DXY is testing the 78.6% Fibonacci retracement at 99.71, but remains capped below the 200-WMA and key structural levels. While RSI is recovering, price still lacks confirmation. A breakout above 99.85–100.00 is needed to shift structure decisively. Until then, short-term strength remains corrective.
⚠️ DISCLAIMER
This analysis is for informational purposes only and does not constitute financial advice. Always consult with a licensed financial professional before making trading decisions.


