
📊 MARKET OVERVIEW
The US Dollar Index (DXY) is once again challenging a familiar resistance zone near 99.50, a level that previously capped bullish attempts in mid-April. The index has now reclaimed both the 50- and 200-period moving averages and displays early signs of renewed upside strength.
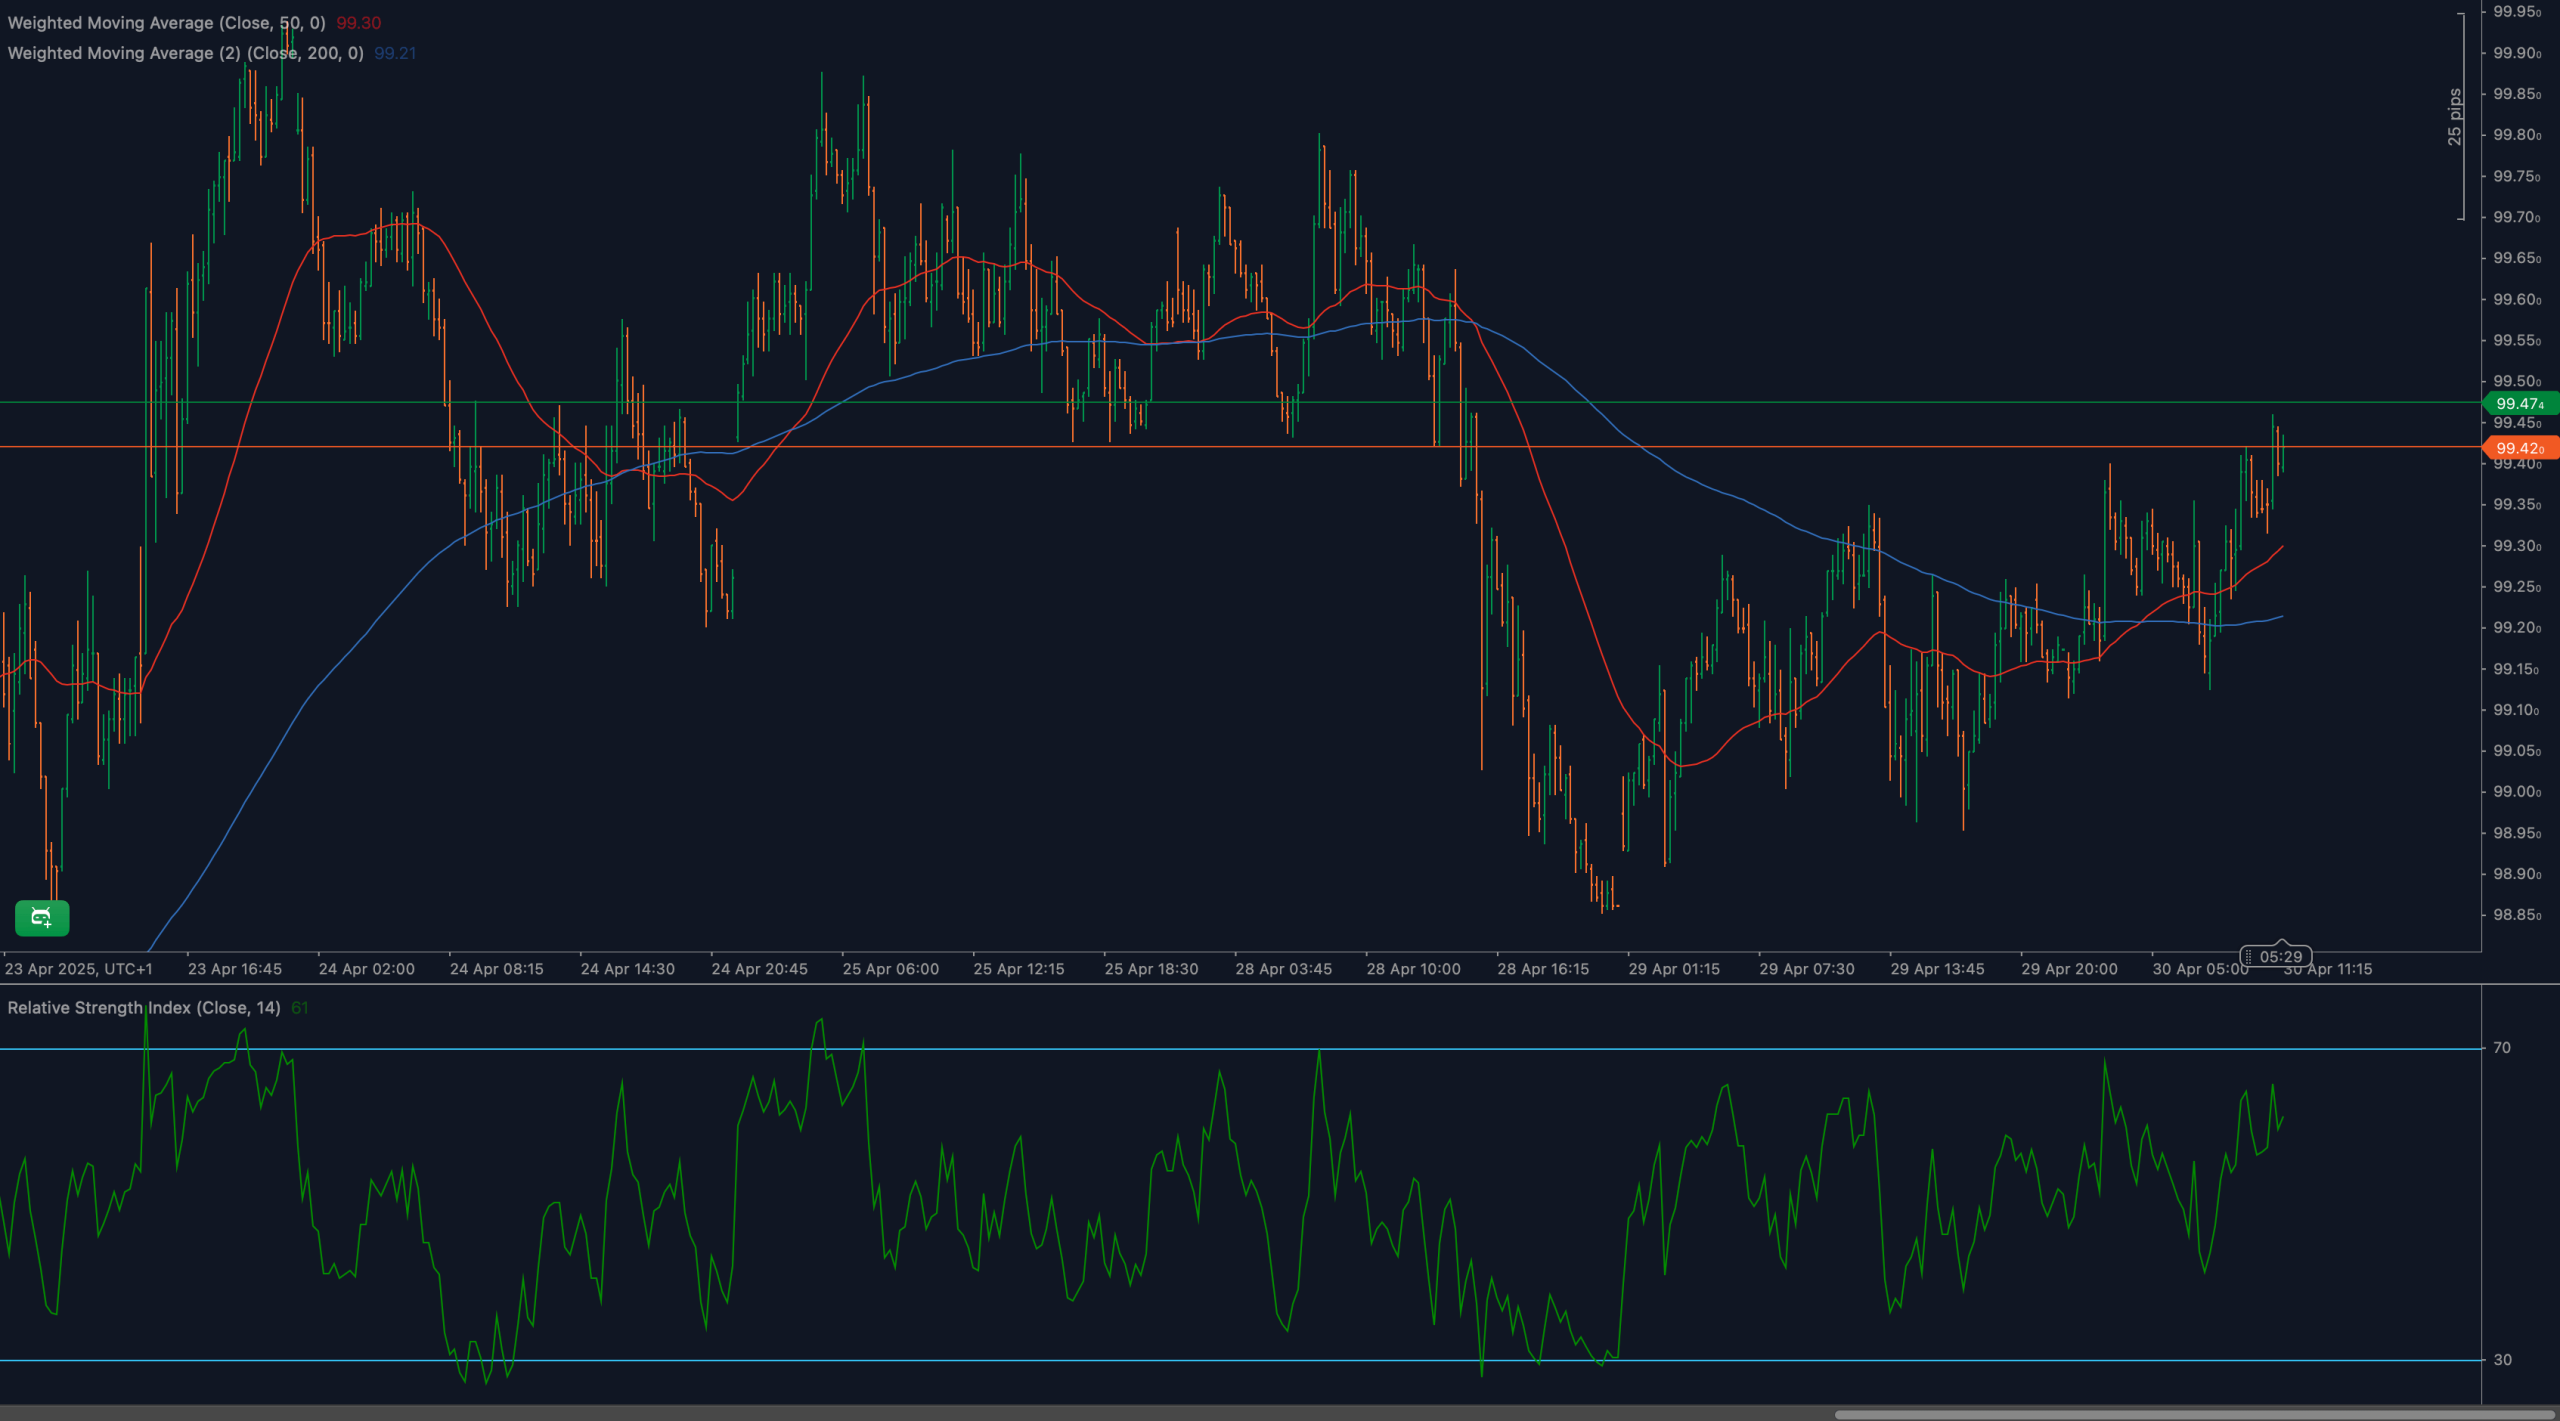
This retest comes with RSI rising steadily above 60 — a level that reflects increasing bullish momentum but still falls short of overbought territory. The Dollar’s ability to break and sustain above this level could reset the short-term trend structure decisively in favor of bulls.
📈 TECHNICAL ANALYSIS
What Are the Key Support and Resistance Levels for DXY?
Immediate resistance is found at 99.50, with upside targets at 99.70 and 99.90 if a breakout is confirmed. Support rests initially at 99.40, followed by stronger zones at 99.20 and 98.95. This tight structure means directional clarity should emerge soon.
Moving Average Analysis and Dynamic Price Levels
Price has reclaimed the 50-period WMA (99.30) and the 200-period WMA (99.21), which are now converging below price and beginning to turn slightly higher. This moving average alignment now acts as strong dynamic support, shifting the bias toward further upside while above them.
RSI Momentum Analysis and Divergence Patterns
The 14-period RSI sits at 61, having climbed steadily from the 45–50 zone earlier in the week. This reflects increasing bullish momentum and the potential to accelerate if price clears resistance. There is no current bearish divergence, but RSI approaching 70 without follow-through in price would warrant caution.
Price Action and Candlestick Analysis
Candles leading into the resistance area show consistent higher closes with small upper wicks, suggesting controlled buying. The current rejection is minor so far, and unless a strong bearish engulfing pattern emerges, bulls remain in control. Volume has remained moderate — a breakout would ideally need a spike in participation.
Chart Patterns and Formation Analysis
DXY appears to be completing a rounded bottom formation, with the neckline aligning almost perfectly at 99.50. A confirmed breakout above this level would activate a continuation pattern, projecting targets at 99.90–100.10. Failure to clear the neckline would maintain the range-bound behavior seen since mid-April.
Fibonacci Retracement Levels and Extension Targets
Using the previous swing high (99.70) and low (98.95), the 61.8% retracement aligns near 99.50, adding further technical weight to the current resistance. Fibonacci extension targets from the recent base breakout suggest potential moves to 99.90 (127.2%) and 100.10 (161.8%) on breakout.
🔍 MARKET OUTLOOK & TRADING SCENARIOS
Bullish Scenario for DXY
A confirmed breakout and close above 99.50, ideally supported by rising RSI and volume, would trigger continuation toward 99.70 and 99.90. RSI pushing into the 65–70 zone would confirm momentum.
Neutral Scenario for DXY
A stall beneath 99.50, with price caught between 99.20–99.50, would reflect short-term indecision. In this case, expect consolidation and potential range-trading conditions. RSI remaining between 55–62 would support this outcome.
Bearish Scenario for DXY
Failure to break 99.50, followed by a drop below 99.20, would tilt the short-term bias bearish. RSI dipping back below 50 and price falling below the 200-WMA would confirm weakness, targeting 98.95 and 98.70.
💼 TRADING CONSIDERATIONS
For bullish entries, a confirmed breakout above 99.50 with a strong candle close could be targeted toward 99.90, with stops placed below 99.30.
Bearish setups may be considered on sharp rejections from 99.50 with follow-through below 99.20, targeting 98.95, with risk controlled above 99.60.
Until breakout or rejection plays out, range-traders could look to fade extremes between 99.20–99.50.
🏁 CONCLUSION
The DXY is at a pivotal juncture, pressing into the long-watched 99.50 resistance. Price action, RSI, and structure suggest the bulls are gaining ground, but confirmation is critical. Whether the Dollar can finally break higher — or face another rejection — will shape the short-term macro narrative.
⚠️ DISCLAIMER
This analysis is for educational purposes only and does not constitute financial advice. Always consult with a licensed professional before making trading decisions.


