
📊 MARKET OVERVIEW
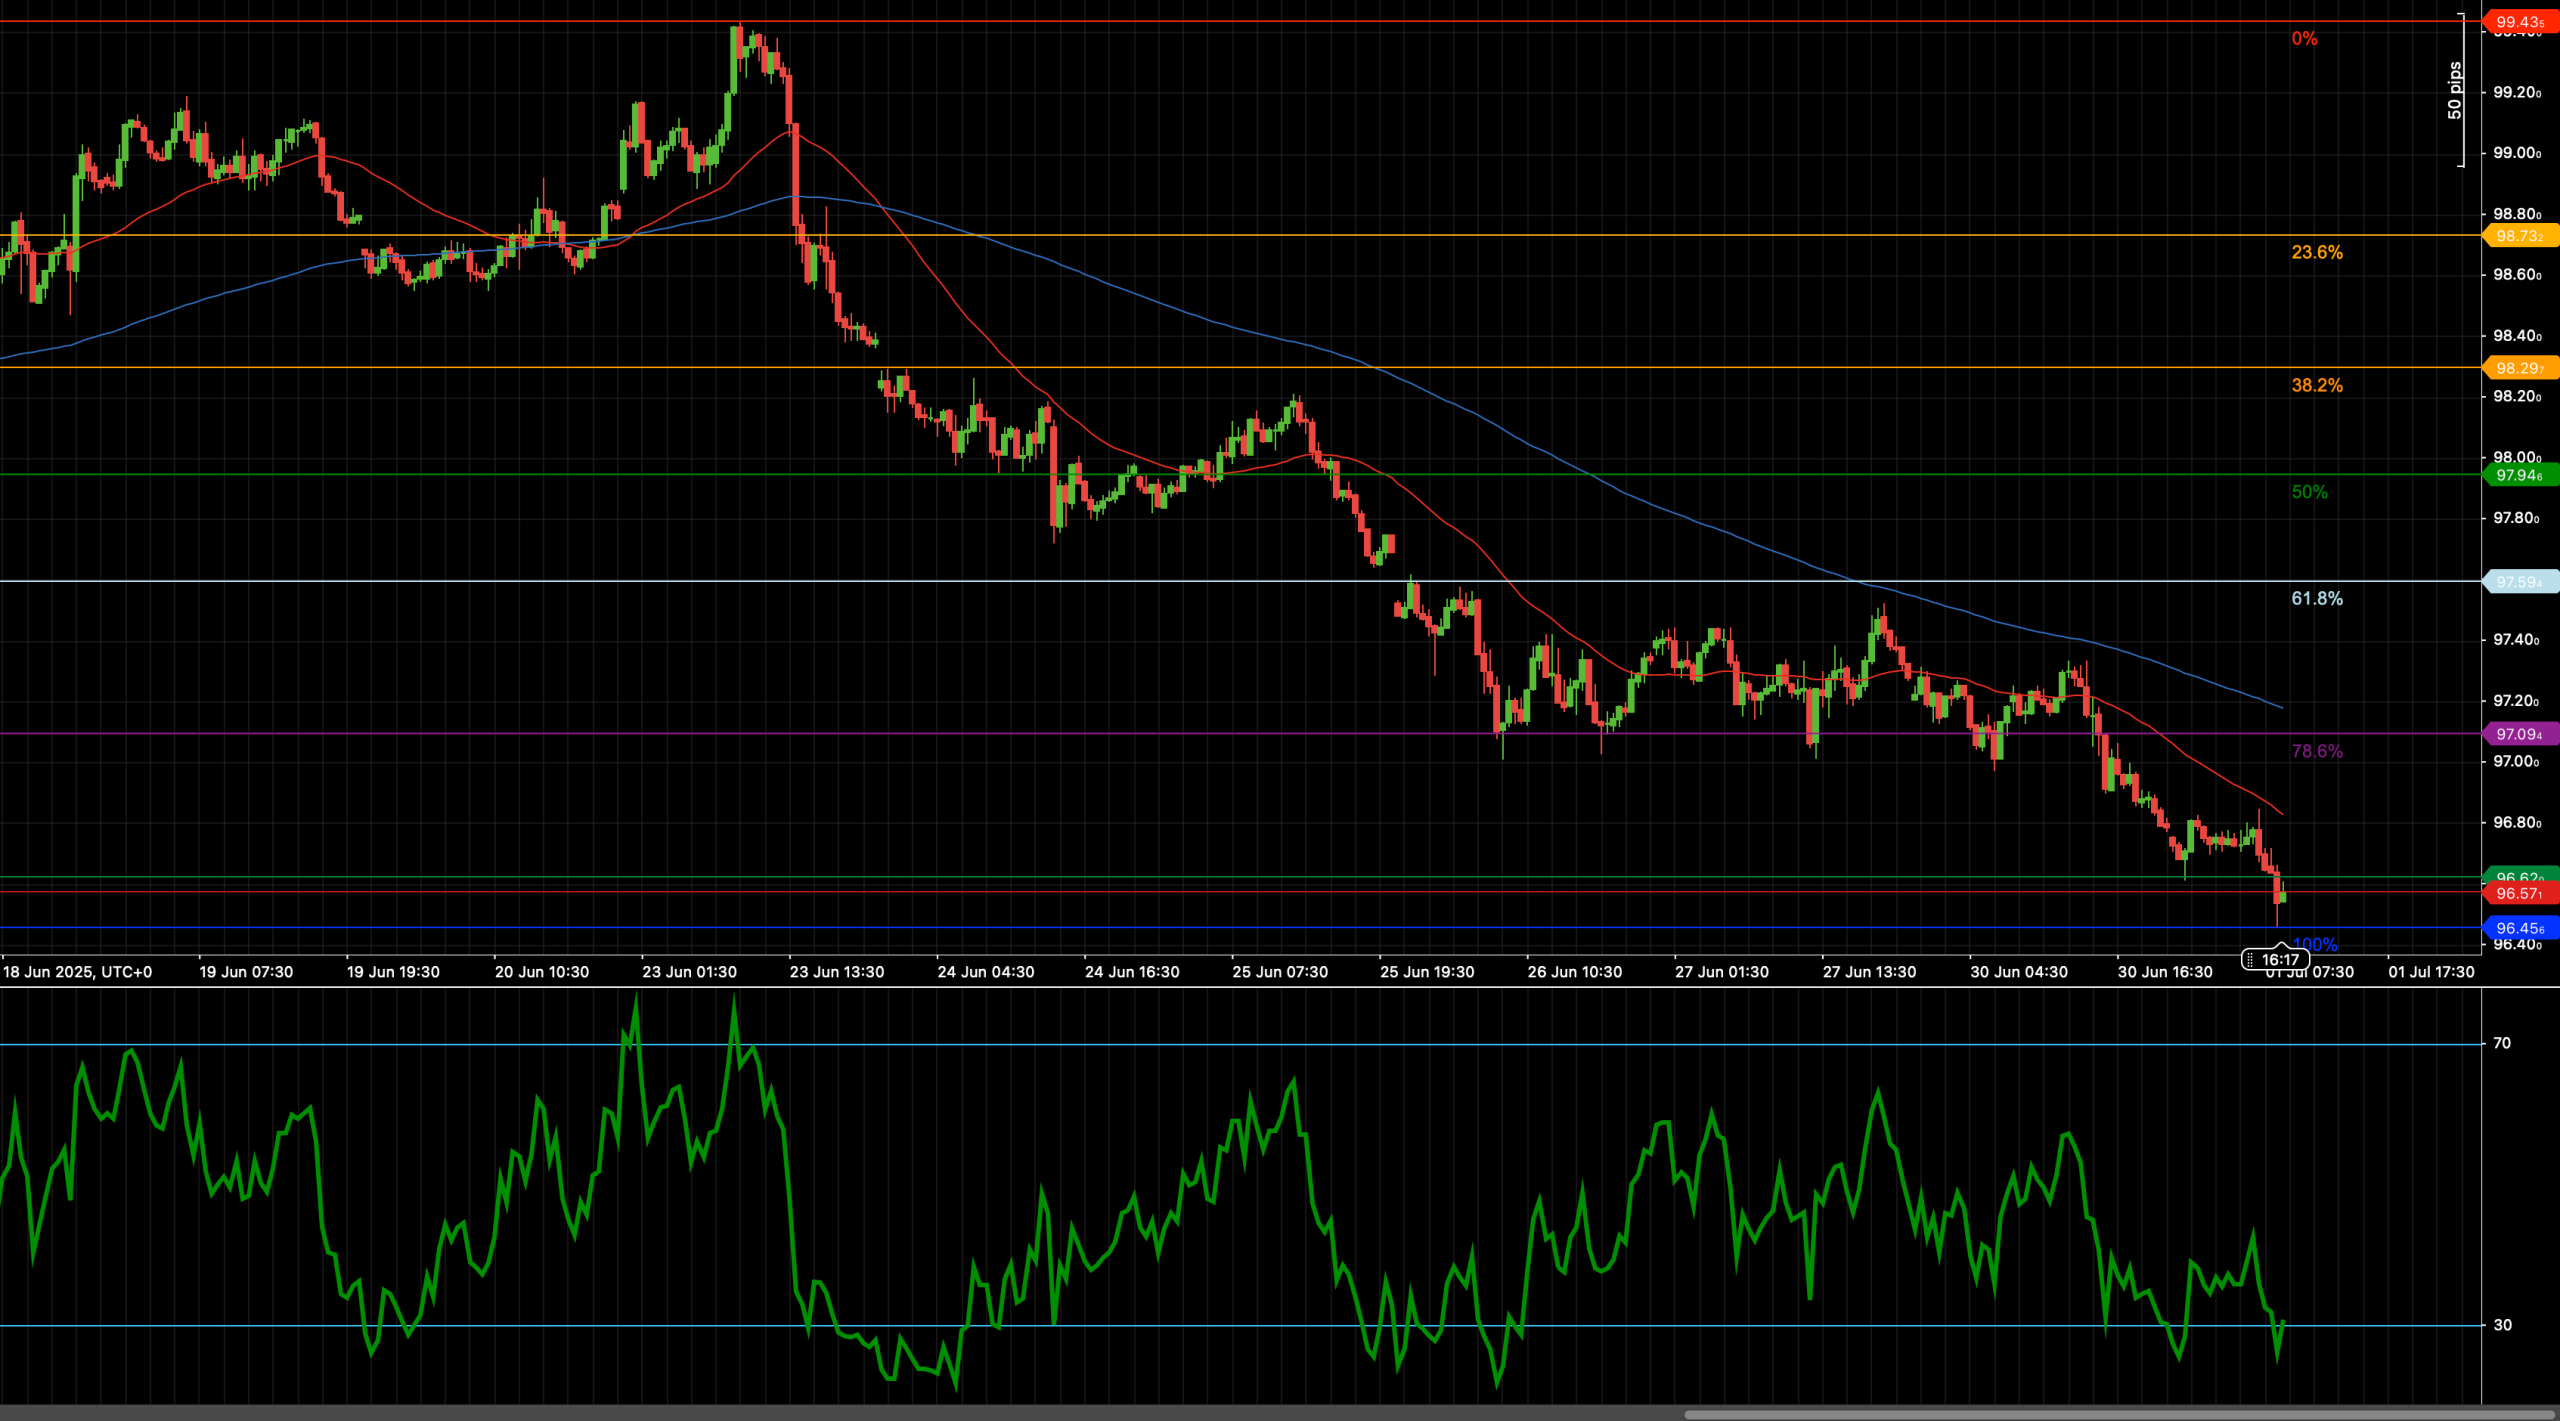
The US Dollar Index has undergone a steep decline throughout the second half of June, losing nearly 300 pips and erasing the entirety of its June rally. The sharp selloff brought DXY to a key technical floor at 96.45 — the 100% Fibonacci retracement level measured from the June 18 low to the June 24 high.
This area is now acting as critical support, especially as no major macro catalysts have emerged to justify extended downside. Dollar weakness has been driven largely by broad risk appetite, a modest decline in US yields, and easing expectations for another Fed hike. However, positioning near the end of quarter and technical exhaustion suggest a pause or mean reversion could develop from here.
📈 TECHNICAL ANALYSIS
Key Support and Resistance Levels
DXY is currently testing the 100% Fibonacci retracement at 96.45, marking a major structural support. A confirmed break below could open the door toward the March swing lows around 96.10. On the upside, initial resistance lies at 96.95, followed by the 78.6% Fib at 97.09. Only a recovery above 97.50 would begin to neutralize the bearish outlook and expose the 98.30–98.70 cluster.
Moving Averages and Dynamic Price Action
The index remains well below both the 50-period and 200-period weighted moving averages, which are currently sloping lower and reinforcing the short-term downtrend. The 200-WMA near 97.50 remains a ceiling that capped prior bounces and may act as a trend re-entry zone for bears. Until price reclaims the moving average band, rallies are likely corrective within a broader bearish structure.
RSI Momentum and Bearish Tilt
The 14-period RSI is hovering just above the 30 threshold, suggesting momentum is stretched but not yet divergent. The indicator has failed to breach 50 throughout the decline and remains stuck in bearish territory. A bounce in RSI above 40 would be an early sign of stabilization, but only a sustained move above 50 would confirm a deeper rebound.
Candlestick Behavior and Price Action Clarity
Price action has been characterized by strong bear candles, shallow retracements, and weak closes, confirming dominance by sellers. However, the current cluster of candles near 96.45 shows shrinking bodies and longer lower wicks, suggesting hesitation or potential base formation. A strong bullish candle closing above 96.95 could initiate a short-covering rally toward 97.50.
Chart Structure and Trend Development
The overall chart pattern reflects a strong impulsive leg lower with limited consolidation — indicative of momentum-driven selling. That said, the completion of a 100% retracement often acts as a natural technical pause. If price can hold this area and construct a base, a temporary reversal may develop. Still, the broader structure remains bearish unless price breaks above the confluence zone near 97.50–97.80.
Fibonacci Retracement and Extension Levels
The June rally from 96.45 to 98.73 has been entirely unwound, with price now sitting directly at the 100% Fibonacci retracement. This level often marks exhaustion or profit-taking in trending markets. A failure to hold here would extend losses toward the 127.2% extension at 96.10 and potentially the psychological 96.00 handle. Upside retracements target 97.09 (78.6%), 97.50 (61.8%), and 97.95 (50%).
🔍 MARKET OUTLOOK & TRADING SCENARIOS
Bullish Scenario:
A bounce off 96.45 with RSI divergence and close above 96.95 would suggest base formation. This could lead to a retest of 97.50, with follow-through potential toward 97.95. Bulls should watch for reversal candles near support zones.
Neutral Scenario:
Consolidation between 96.45 and 96.95 could persist as the market digests recent losses. In this case, RSI would likely flatten and price action may chop around in tight range without directional bias.
Bearish Scenario:
A confirmed breakdown below 96.45 on strong volume would resume the broader downtrend. Targets include 96.10 (127.2% extension) and 95.85. This would confirm the bearish continuation from June highs.
💼 TRADING CONSIDERATIONS
- Bullish Setup: Buy above 96.95, target 97.50 and 97.95; stop below 96.40
- Bearish Setup: Sell on break below 96.45, target 96.10 and 95.85; stop above 96.95
- Range Setup: Fade moves near 96.45 or 96.95 with tight stops and RSI confirmation
🏁 CONCLUSION
DXY is now trading at the 100% Fibonacci retracement of its recent rally, a level that may act as a pivot for bulls attempting to arrest the decline. However, the bearish momentum remains dominant, and only a reclaim of key resistance zones would reverse the short-term trend. Until that occurs, sellers may continue to control the tape.
⚠️ DISCLAIMER
This analysis is for informational purposes only and does not constitute financial advice. Always consult a licensed financial advisor before making trading decisions.


