
📊 MARKET OVERVIEW
The US Dollar Index (DXY) has been navigating a complex technical landscape, establishing a period of consolidation following a significant downtrend from the 105.60 region. Currently hovering near the critical 104.00 psychological level, the dollar index is showing early signs of potential bullish momentum as it forms a series of higher lows on the short-term timeframe. This consolidation phase comes amid market speculation about the Federal Reserve’s monetary policy trajectory and shifting global risk sentiment, creating a nuanced trading environment for currency markets.
Recent price action reveals the DXY attempting to establish a foothold above the 50-day moving average, which has consistently acted as dynamic resistance throughout the decline. Trading volumes have seen notable increases during upside attempts, particularly as the index approaches the 104.00 resistance zone, suggesting accumulating interest from institutional participants. This technical juncture is particularly significant as it coincides with several other critical market factors, including Treasury yield movements and positioning ahead of upcoming economic data releases.
📈 TECHNICAL ANALYSIS
What Are the Key Support and Resistance Levels for DXY?
The DXY chart reveals several significant technical levels that are currently influencing price action. The most prominent resistance level sits at 104.00, which has repeatedly capped upside momentum and corresponds with previous structural support that has now transformed into resistance. This level is reinforced by the psychological significance of the round number and its historical role as a pivot point. Secondary resistance appears at 104.20, where previous consolidation activity occurred, followed by more substantial resistance at 104.40, which aligns with the descending trendline from earlier highs.
On the support side, the immediate floor is established at 103.60, which has provided reliable support during recent pullbacks and corresponds with the lower boundary of the current consolidation range. Below this, more substantial support exists at 103.40, which represents the recent swing low and a level where buying interest has previously emerged. The tertiary support zone between 103.00-103.20 represents a critical area that, if breached, could trigger a more significant downside extension. These support and resistance boundaries are creating a well-defined trading range that market participants are closely monitoring for potential breakout signals.
Moving Average Analysis and Dynamic Price Levels
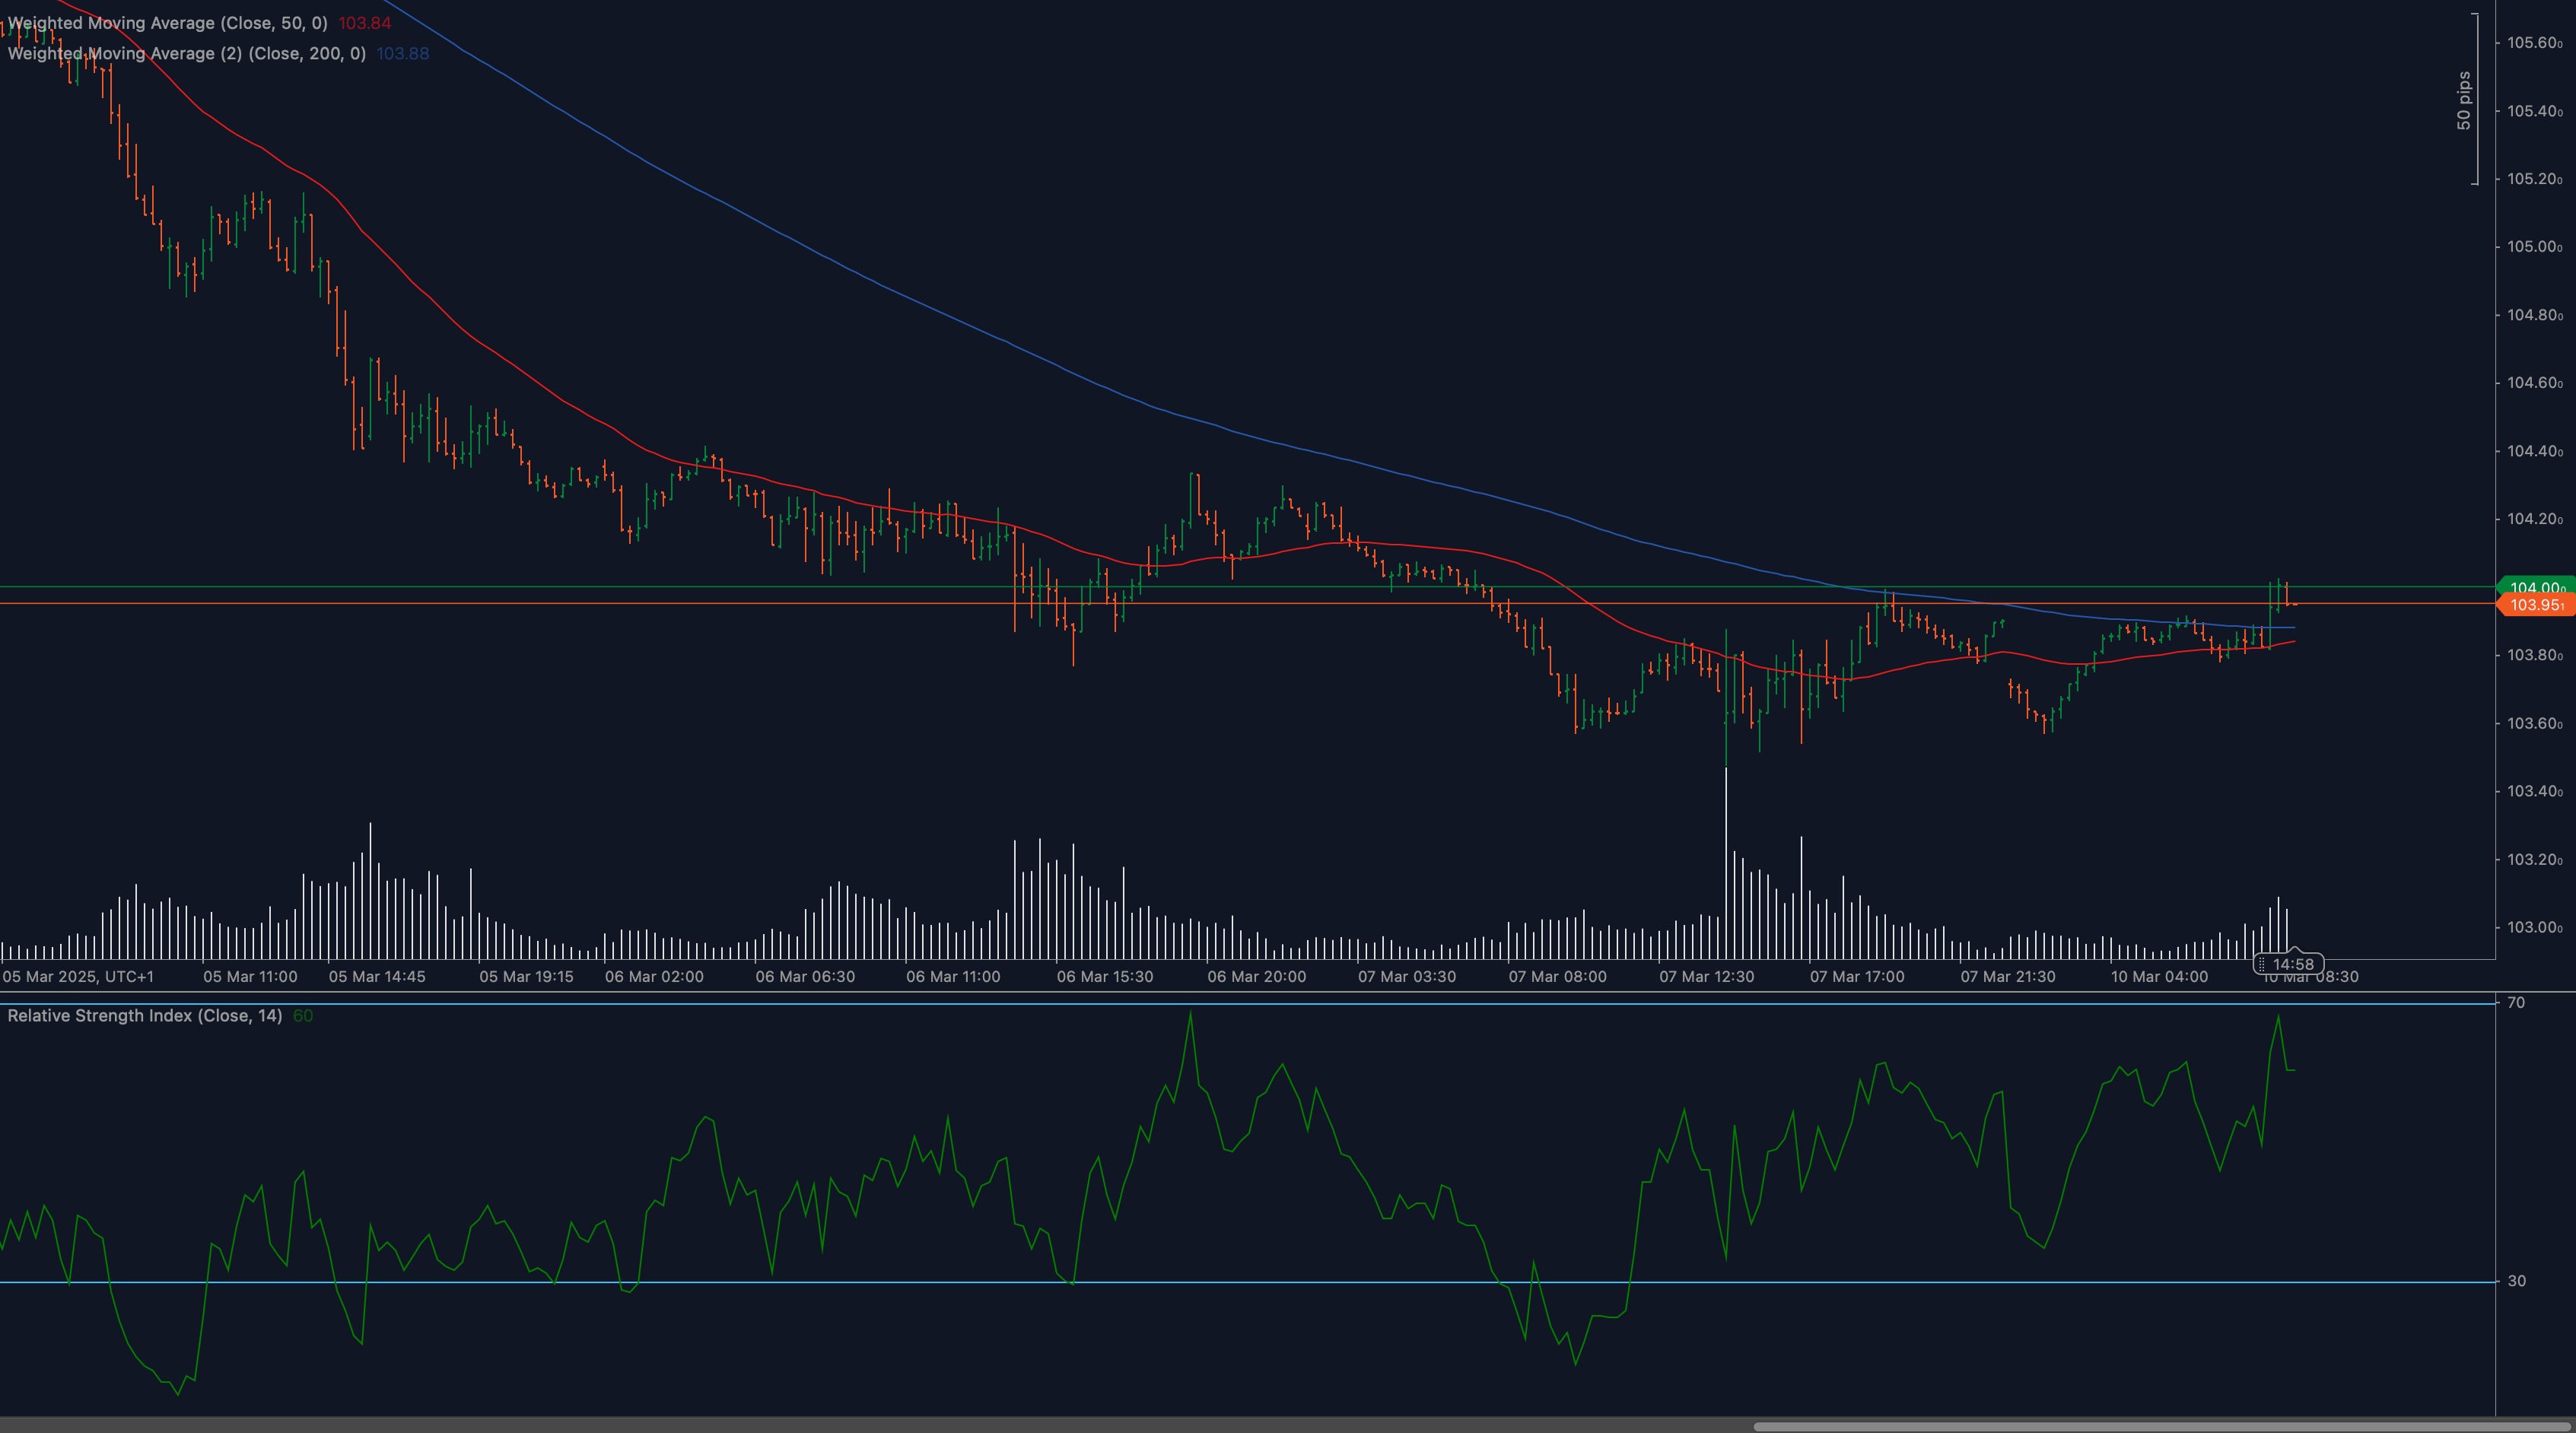
The 50-day moving average (displayed in red on the chart at 103.84) is currently playing a crucial role as dynamic resistance, with price repeatedly testing but failing to establish sustained momentum above this indicator. The declining slope of this moving average confirms the medium-term downtrend remains technically intact despite recent consolidation. Meanwhile, the 200-day moving average (shown in blue at 104.38) looms overhead as a more significant barrier that would need to be overcome for a true trend reversal to be confirmed.
The relationship between price and these moving averages creates a technical framework where the DXY is essentially compressed between shorter-term support and longer-term resistance. The convergence of the 50-day MA with current price action suggests we’re at an inflection point where momentum could shift. Notably, recent candles have begun to close above the 50-day MA, which represents an early signal of potential bullish momentum development if sustained.
RSI Momentum Analysis and Divergence Patterns
The Relative Strength Index (RSI-14) displayed at the bottom of the chart provides valuable insights into underlying momentum characteristics. After spending considerable time in neutral territory between 30-70, the RSI has recently begun trending higher, currently reading near 70, which indicates strengthening bullish momentum. Particularly noteworthy is the positive divergence that has formed, with the RSI making higher lows while price was still making lower lows during the early March period.
This divergence often precedes price reversals and suggests diminishing bearish pressure. The RSI has not yet entered overbought territory above 70, indicating potential room for continued upside momentum before exhaustion signals appear. Traders should monitor for potential RSI resistance at the 70 mark, as previous touches of this level have corresponded with short-term price pullbacks. The overall momentum profile suggests building bullish pressure, though confirmation through price action is still required.
Price Action and Candlestick Analysis
Examining the candlestick patterns reveals several noteworthy developments in DXY price action. The formation of consecutive higher lows since March 7th suggests gradual bullish pressure building, while upper wicks on several recent candles near the 104.00 level indicate persistent selling interest at resistance. The March 6-7 period established a double bottom formation near 103.40, which provided the foundation for the current recovery attempt.
Recent candles display increasing bullish characteristics, including stronger bodies and lower wicks indicating buying on dips. Particularly significant is the bullish engulfing pattern that formed on March 8th, suggesting rejection of lower prices and potential trend reversal. The consistent respect of the 103.60 support level during recent pullbacks reinforces this level’s technical significance. Current price action is displaying characteristics of a consolidation pattern that typically precedes directional moves, with compression between narrowing support and resistance boundaries.
Chart Patterns and Formation Analysis
The DXY is currently forming a recognizable rectangle consolidation pattern between the 103.60 support and 104.00 resistance levels. This horizontal trading range represents equilibrium between buyers and sellers following the previous downtrend. The pattern is nearing completion as price approaches the upper boundary with increasing momentum, suggesting a potential breakout scenario developing. The measured move target for a bullish resolution would project toward the 104.40 region.
Additionally, the broader price structure reveals an inverse head and shoulders pattern potentially forming, with the left shoulder around March 6, the head at the March 7 low, and the right shoulder developing around March 9. This formation, if completed with a break above the neckline near 104.00, would signal a more significant trend reversal with implications for dollar strength. The volume profile supports this potential formation, with increasing participation during recent upside attempts.
Fibonacci Retracement Levels and Extension Targets
Applying Fibonacci analysis to the recent downtrend from 105.60 to 103.40 highlights several key retracement levels currently influencing price action. The 38.2% retracement at approximately 104.20 aligns closely with the secondary resistance level identified earlier, while the 50% retracement at 104.50 corresponds with the 200-day moving average zone. These confluence areas represent significant technical barriers that would need to be overcome for sustained bullish momentum.
On the downside, the 103.40 level represents the 0% Fibonacci level (the recent swing low), with the 103.00 area representing a potential 127.2% extension if bearish momentum were to resume. For bullish scenarios, the 61.8% retracement at 104.80 would represent the next major target following a confirmed breakout above current resistance. These Fibonacci levels provide a framework for potential price targets in both directions depending on how the current consolidation resolves.
🔍 MARKET OUTLOOK & TRADING SCENARIOS
Bullish Scenario for DXY
The bullish case for the US Dollar Index centers on a decisive break above the 104.00 resistance level with strong momentum and volume confirmation. Such a breakout would likely trigger stops placed by short sellers and potentially accelerate upside movement toward the 104.20-104.40 resistance zone. For this scenario to develop, we would expect to see continued strength in the RSI indicator, preferably maintaining readings above 60, along with price establishing sustained closes above the 50-day moving average. The measured move target from the rectangle pattern projects toward 104.40, while completion of the inverse head and shoulders pattern would suggest potential toward the 104.80 region.
This bullish resolution would likely coincide with rising US Treasury yields, hawkish Federal Reserve commentary, or weaker-than-expected economic data from competing currency blocs. Early warning signs supporting this scenario include increasing buying volume on upside attempts, bullish divergences in momentum indicators, and narrowing daily trading ranges as price approaches resistance. Confirmation would require consecutive daily closes above 104.00 with follow-through momentum.
Neutral Scenario for DXY
The neutral outlook envisions continued consolidation within the established 103.60-104.00 range as market participants await additional catalysts before committing to directional positions. This scenario would be characterized by decreasing volume, narrowing daily ranges, and oscillation of the RSI between 40-60. Price would likely continue to respect both the upper and lower boundaries of the current trading range, potentially forming additional tests of these levels without decisive breakouts.
This scenario becomes increasingly probable if mixed economic signals continue from major economies, creating an uncertain backdrop for currency markets. Traders operating under this scenario would focus on range-trading strategies, selling near resistance and buying near support while maintaining tight risk management parameters. The neutral scenario could persist until major economic releases or central bank communications provide clearer directional catalysts.
Bearish Scenario for DXY
The bearish case would be triggered by a convincing break below the 103.60 support level, particularly if accompanied by increasing volume and deteriorating momentum indicators. This would invalidate the current consolidation structure and potentially initiate a test of the more substantial 103.40 support, with risk of extension toward the 103.00 psychological level if selling pressure accelerates. For this scenario to unfold, we would expect to see rejection at the 50-day moving average, failure to break above 104.00 despite multiple attempts, and weakening RSI readings below 40.
A bearish resolution would likely coincide with dovish Federal Reserve communications, stronger-than-expected economic data from competing currency blocs, or renewed risk appetite in global markets. Warning signs for this scenario include decreasing volume on rally attempts, bearish candlestick patterns near resistance levels, and inability to maintain momentum above the 50-day moving average. Confirmation would require consecutive daily closes below 103.60 with follow-through selling pressure.
💼 TRADING CONSIDERATIONS
Traders approaching the DXY in the current technical environment should consider several practical strategies aligned with their directional bias and risk tolerance. For bullish positions, establishing longs near the 103.70 support with stops below 103.55 offers favorable risk-reward, targeting initial resistance at 104.00 and extended targets at 104.40 if breakout momentum develops. This approach provides approximately 1:2 risk-reward while positioning for potential upside resolution.
For bearish strategies, waiting for clear rejection at the 104.00 resistance before establishing shorts provides optimal entry, with stops placed above 104.15 and targets at 103.60 initially, extending to 103.40 if momentum accelerates. Alternatively, range-bound traders can exploit the current consolidation by establishing longs near 103.60-103.70 with tight stops, while simultaneously preparing to reverse positions near 103.95-104.00 resistance.
Risk management remains paramount in the current environment, with position sizing reflecting the relatively narrow trading range. Traders should adjust expectations accordingly, with profit targets aligned to the compressed volatility environment. Given the significance of the 104.00 level, consider implementing trailing stops on long positions if this level is breached to protect profits while allowing for potential continuation. Additionally, monitoring correlated assets such as EUR/USD, gold, and US Treasury yields provides valuable context for DXY movements and potential leading indicators for breakouts.
🏁 CONCLUSION
The US Dollar Index is navigating a technically significant juncture, with price compressed between established support at 103.60 and resistance at 104.00. Recent price action suggests building bullish pressure, with the RSI momentum indicator confirming this through positive divergence and strengthening readings. While the medium-term downtrend remains technically intact below the 200-day moving average, short-term signals indicate potential for a bullish resolution to the current consolidation pattern.
Traders should maintain vigilance around the critical 104.00 resistance level, as a decisive break above would signal a potentially significant shift in dollar momentum with implications across currency and commodity markets. Conversely, failure at this resistance could reinforce the broader downtrend, with renewed bearish pressure targeting support at 103.40 and potentially lower. The technical structure suggests we’re approaching a resolution to the current consolidation, with the coming sessions likely to provide clearer directional signals for DXY traders.
⚠️ DISCLAIMER
This analysis is for informational purposes only and should not be considered financial advice. Trading carries risk, and past performance does not guarantee future results. Conduct independent research before making investment decisions.


