
📊 MARKET OVERVIEW
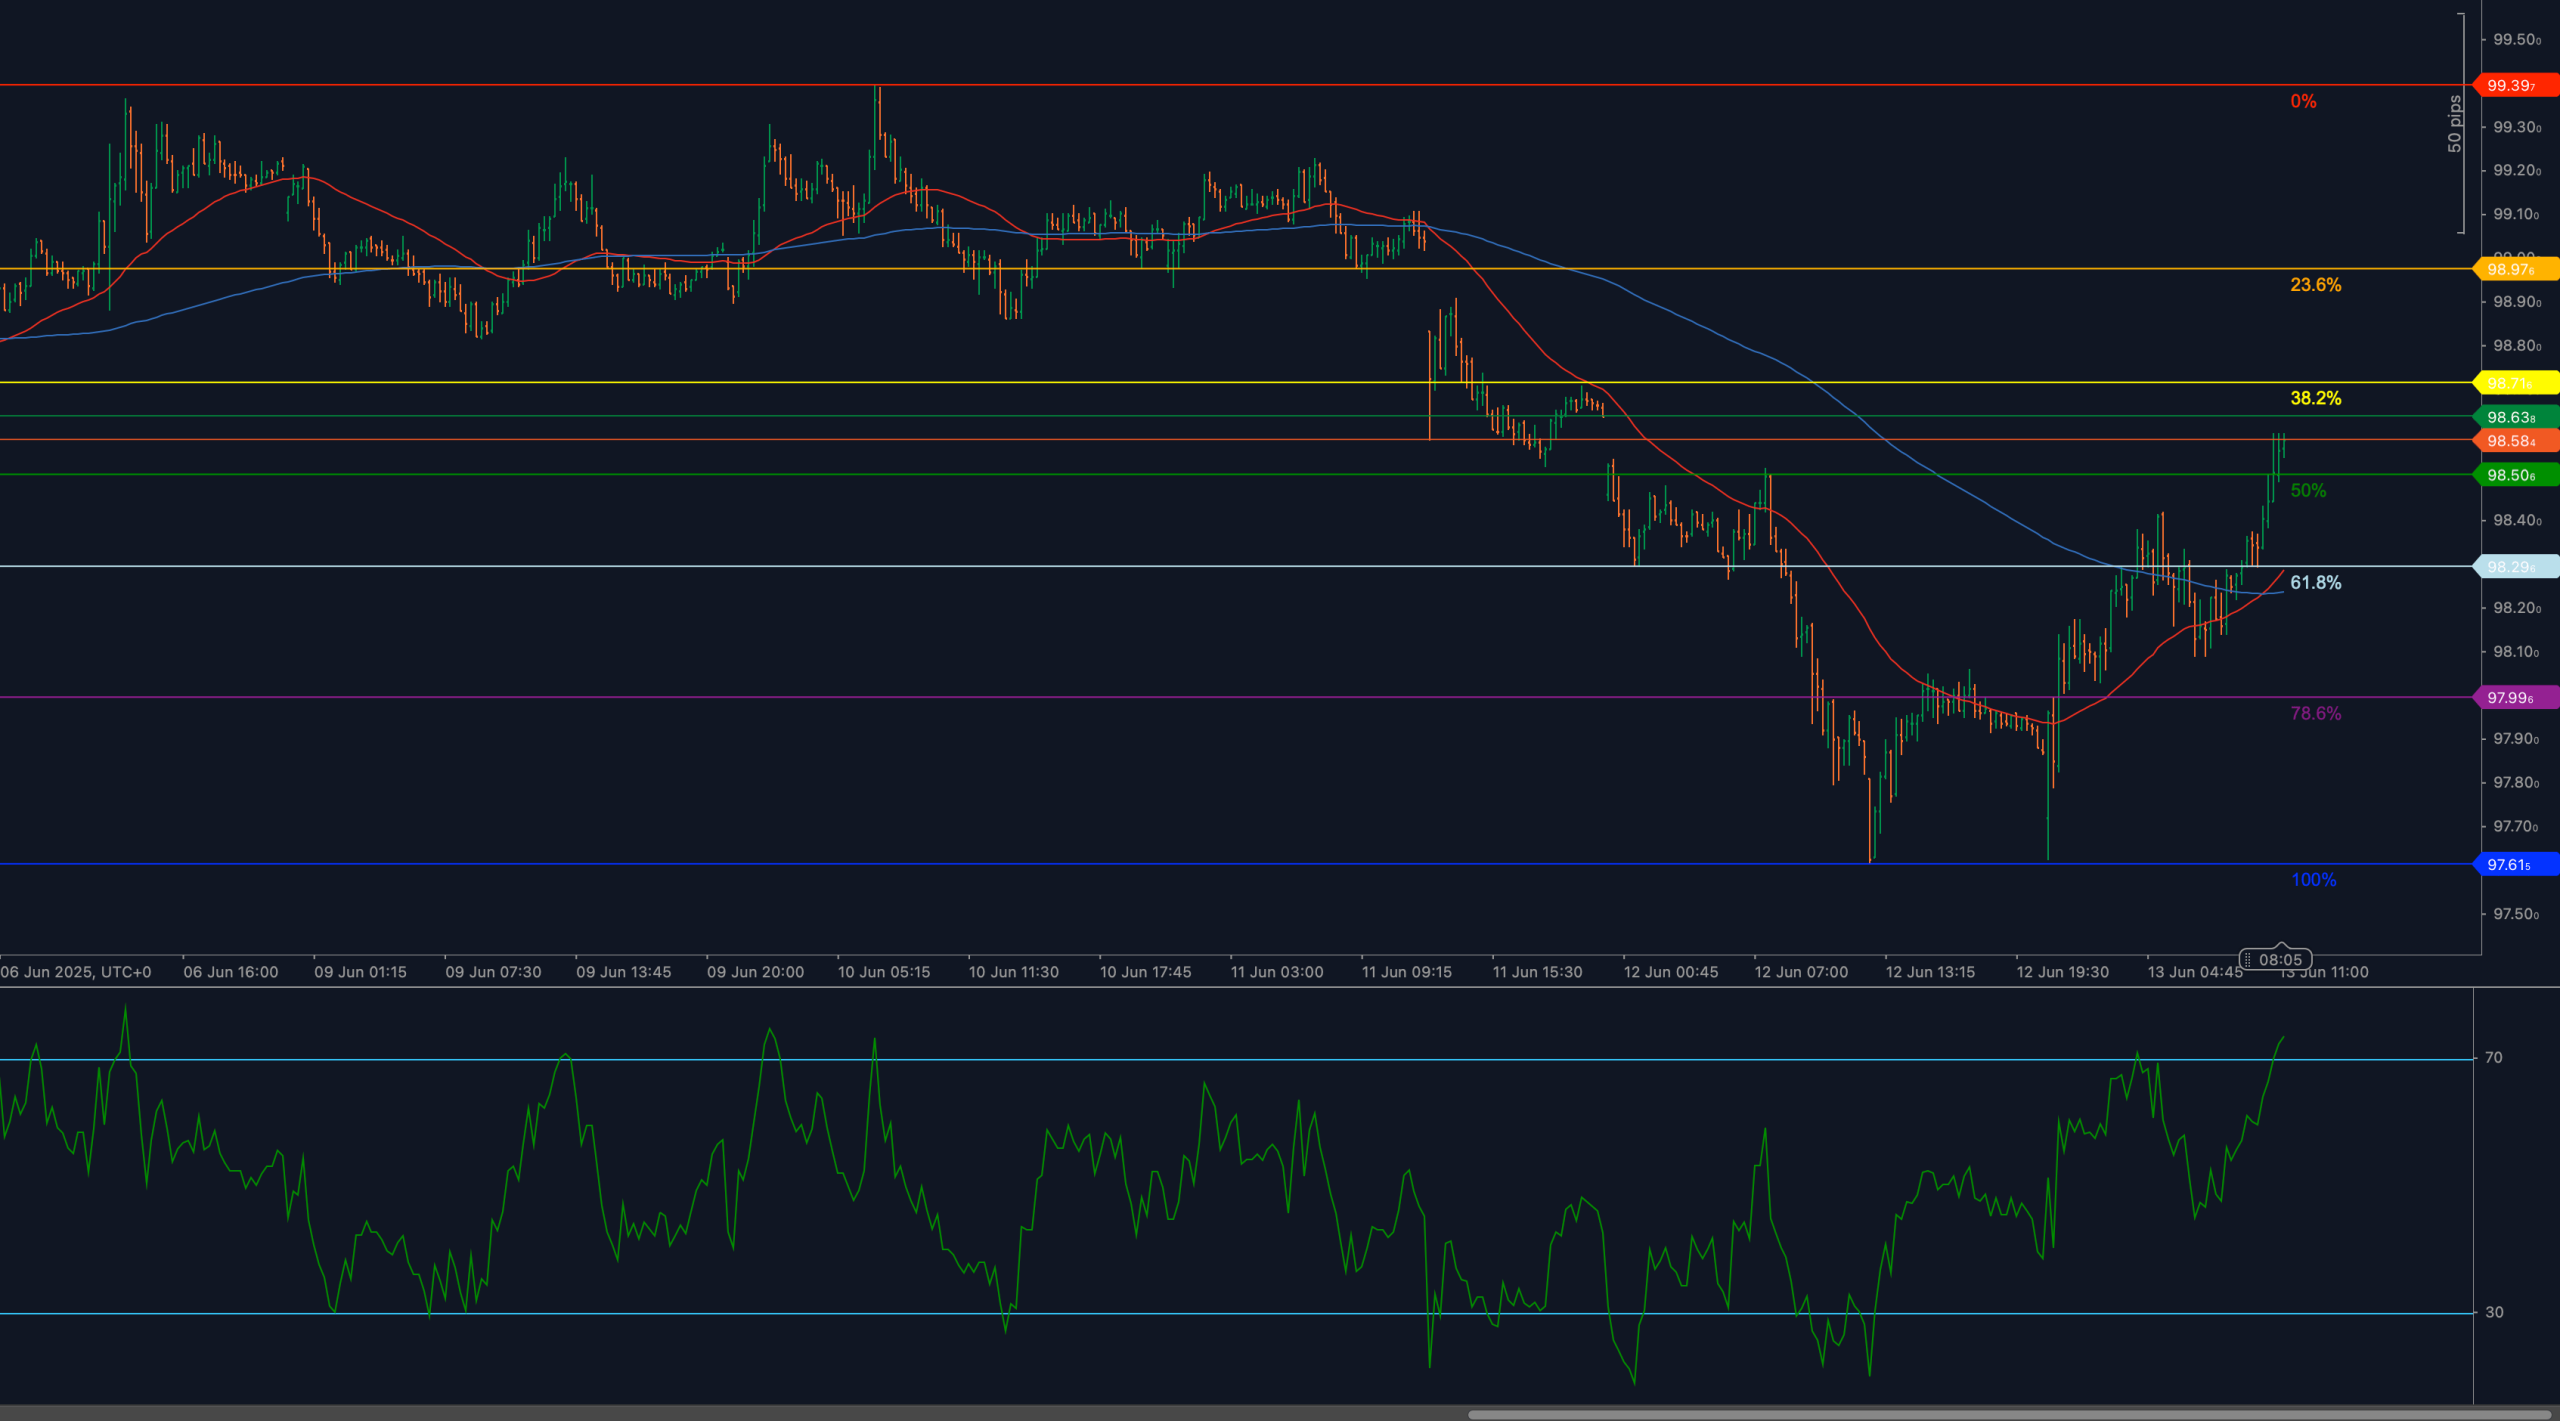
The U.S. Dollar Index (DXY) has continued its rebound sequence, pushing firmly above 98.29, the 61.8% Fibonacci retracement of the May-June decline. This move confirms a significant technical shift as prior bearish pressure is now being replaced by a reacceleration phase. The surge is supported by intraday momentum and a steep recovery off last week’s lows, which were anchored around the 97.61 Fibonacci base.
As U.S. rate expectations stabilize and safe-haven demand returns, DXY has benefited from renewed interest. The rally is also notable for reclaiming both key moving averages, adding to the structural case for further upside. Market participants are now watching the 98.58–98.63 resistance zone, which combines horizontal structure with the 38.2% retracement from the April top.
Unless price fails abruptly at these levels, bullish sentiment is likely to persist, with trend structure beginning to lean in favor of dollar strength.
📈 TECHNICAL ANALYSIS
Key Support and Resistance Levels
Immediate resistance lies at 98.58–98.63, a zone that aligns with a prior intraday pivot and the 38.2% Fibonacci retracement from the broader May peak at 99.39. A clean break above this zone would open the path toward the 98.97–99.05 area, with 99.39 marking the full retracement and key medium-term target. To the downside, the 61.8% level at 98.29 now acts as immediate support, followed by the psychological 98.00 round number. Deeper support lies at 97.99 (78.6% retracement) and 97.61, the swing low from which this leg originated.
Moving Averages and Dynamic Price Action
Price has now crossed above both the 50-period and 200-period weighted moving averages, with the 50-WMA turning upward. This bullish cross adds to the case for a trend reversal, especially as both averages now provide dynamic support just beneath 98.20. These moving averages had previously acted as bearish rejection zones during the May slide but are now being reclaimed, reinforcing directional change. So long as price holds above this dual-MA zone, pullbacks are likely to attract renewed buying interest.
RSI Momentum and Bullish Acceleration
The Relative Strength Index (14) has surged above 65 and is approaching overbought levels. This sharp upward move confirms the momentum behind the current rally and shows no sign of bearish divergence at this stage. As long as RSI sustains above 55–60, the bias remains strongly bullish. A minor consolidation is possible near the 70 zone, but unless a clear reversal signal appears, this RSI behavior supports further continuation toward higher targets.
Candlestick Behavior and Price Action Clarity
Recent candles display strong bullish body formations, with clean closes above prior resistance and minimal upper wicks. The breakout through 98.29 occurred with a wide-bodied candle and was followed by continuation — a textbook bullish impulse sequence. There are no signs of rejection yet, although short-term consolidation may emerge beneath 98.63. If price prints a reversal candle in this region (e.g., long upper wick or bearish engulfing), that would shift the bias to corrective. Until then, price action structure favors the bulls.
Chart Structure and Trend Shift
Structurally, the chart reflects a V-shaped reversal from the 97.61 low, reclaiming multiple retracement levels and breaking through key moving average resistance. This rally has reset the short-term trend and transformed the previous bearish channel into a base-building structure. With consecutive higher highs and higher lows now confirmed, DXY has transitioned into a bullish phase. The current breakout leg appears impulsive, and unless price sharply fails at 98.63, the structural focus will shift toward trend extension rather than mean reversion.
Fibonacci Retracement and Extension Levels
The Fibonacci retracement from 99.39 (May 30 high) to 97.61 (June 12 low) has been a key technical roadmap. DXY has now cleared the 61.8% retracement at 98.29 and is challenging the 38.2% retracement at 98.63. If price sustains this advance, the next major target lies at 98.97, the 23.6% retracement, followed by 99.39 — the full recovery point. On the downside, 98.29 remains pivotal support, with 97.99 and 97.61 representing key structural levels should reversal pressure emerge. The overall retracement sequence currently favors bullish continuation unless these lower supports are broken.
🔍 MARKET OUTLOOK & TRADING SCENARIOS
Bullish Scenario
If price clears 98.63 on strong volume, with RSI holding near 70 or higher, a breakout continuation is likely toward 98.97 and 99.39. Buyers may step in on shallow pullbacks above 98.29, using dynamic support to re-enter with minimal risk.
Neutral Scenario
Failure to break above 98.63, with RSI flattening near 60–65, could result in consolidation between 98.29–98.63. In this case, a flag or range formation may precede the next directional move.
Bearish Scenario
A sharp rejection at 98.63, confirmed with a bearish candle and RSI dropping below 55, would signal exhaustion. This could trigger a correction back to 98.00 or even 97.99. A break below 97.61 would reestablish bearish control.
💼 TRADING CONSIDERATIONS
Bulls are favored above 98.29, with structure and momentum aligning for continued upside. Pullbacks into dynamic support and RSI above 60 may offer buying opportunities targeting 98.97. Bears must await a rejection and reversal pattern near resistance zones. Until such a shift occurs, short positions remain high-risk.
🏁 CONCLUSION
DXY has broken above 98.29 and is challenging the 38.2% Fibonacci level at 98.63, supported by rising RSI and strong bullish price structure. Unless price fails decisively at this resistance, the rally appears poised to continue toward 98.97 and 99.39. The technical landscape has turned bullish, and the next few sessions will determine whether this move evolves into a full trend reversal.
⚠️ DISCLAIMER
This analysis is for informational purposes only and does not constitute financial advice. Always consult with a licensed financial professional before making trading decisions.


