
📊 MARKET OVERVIEW
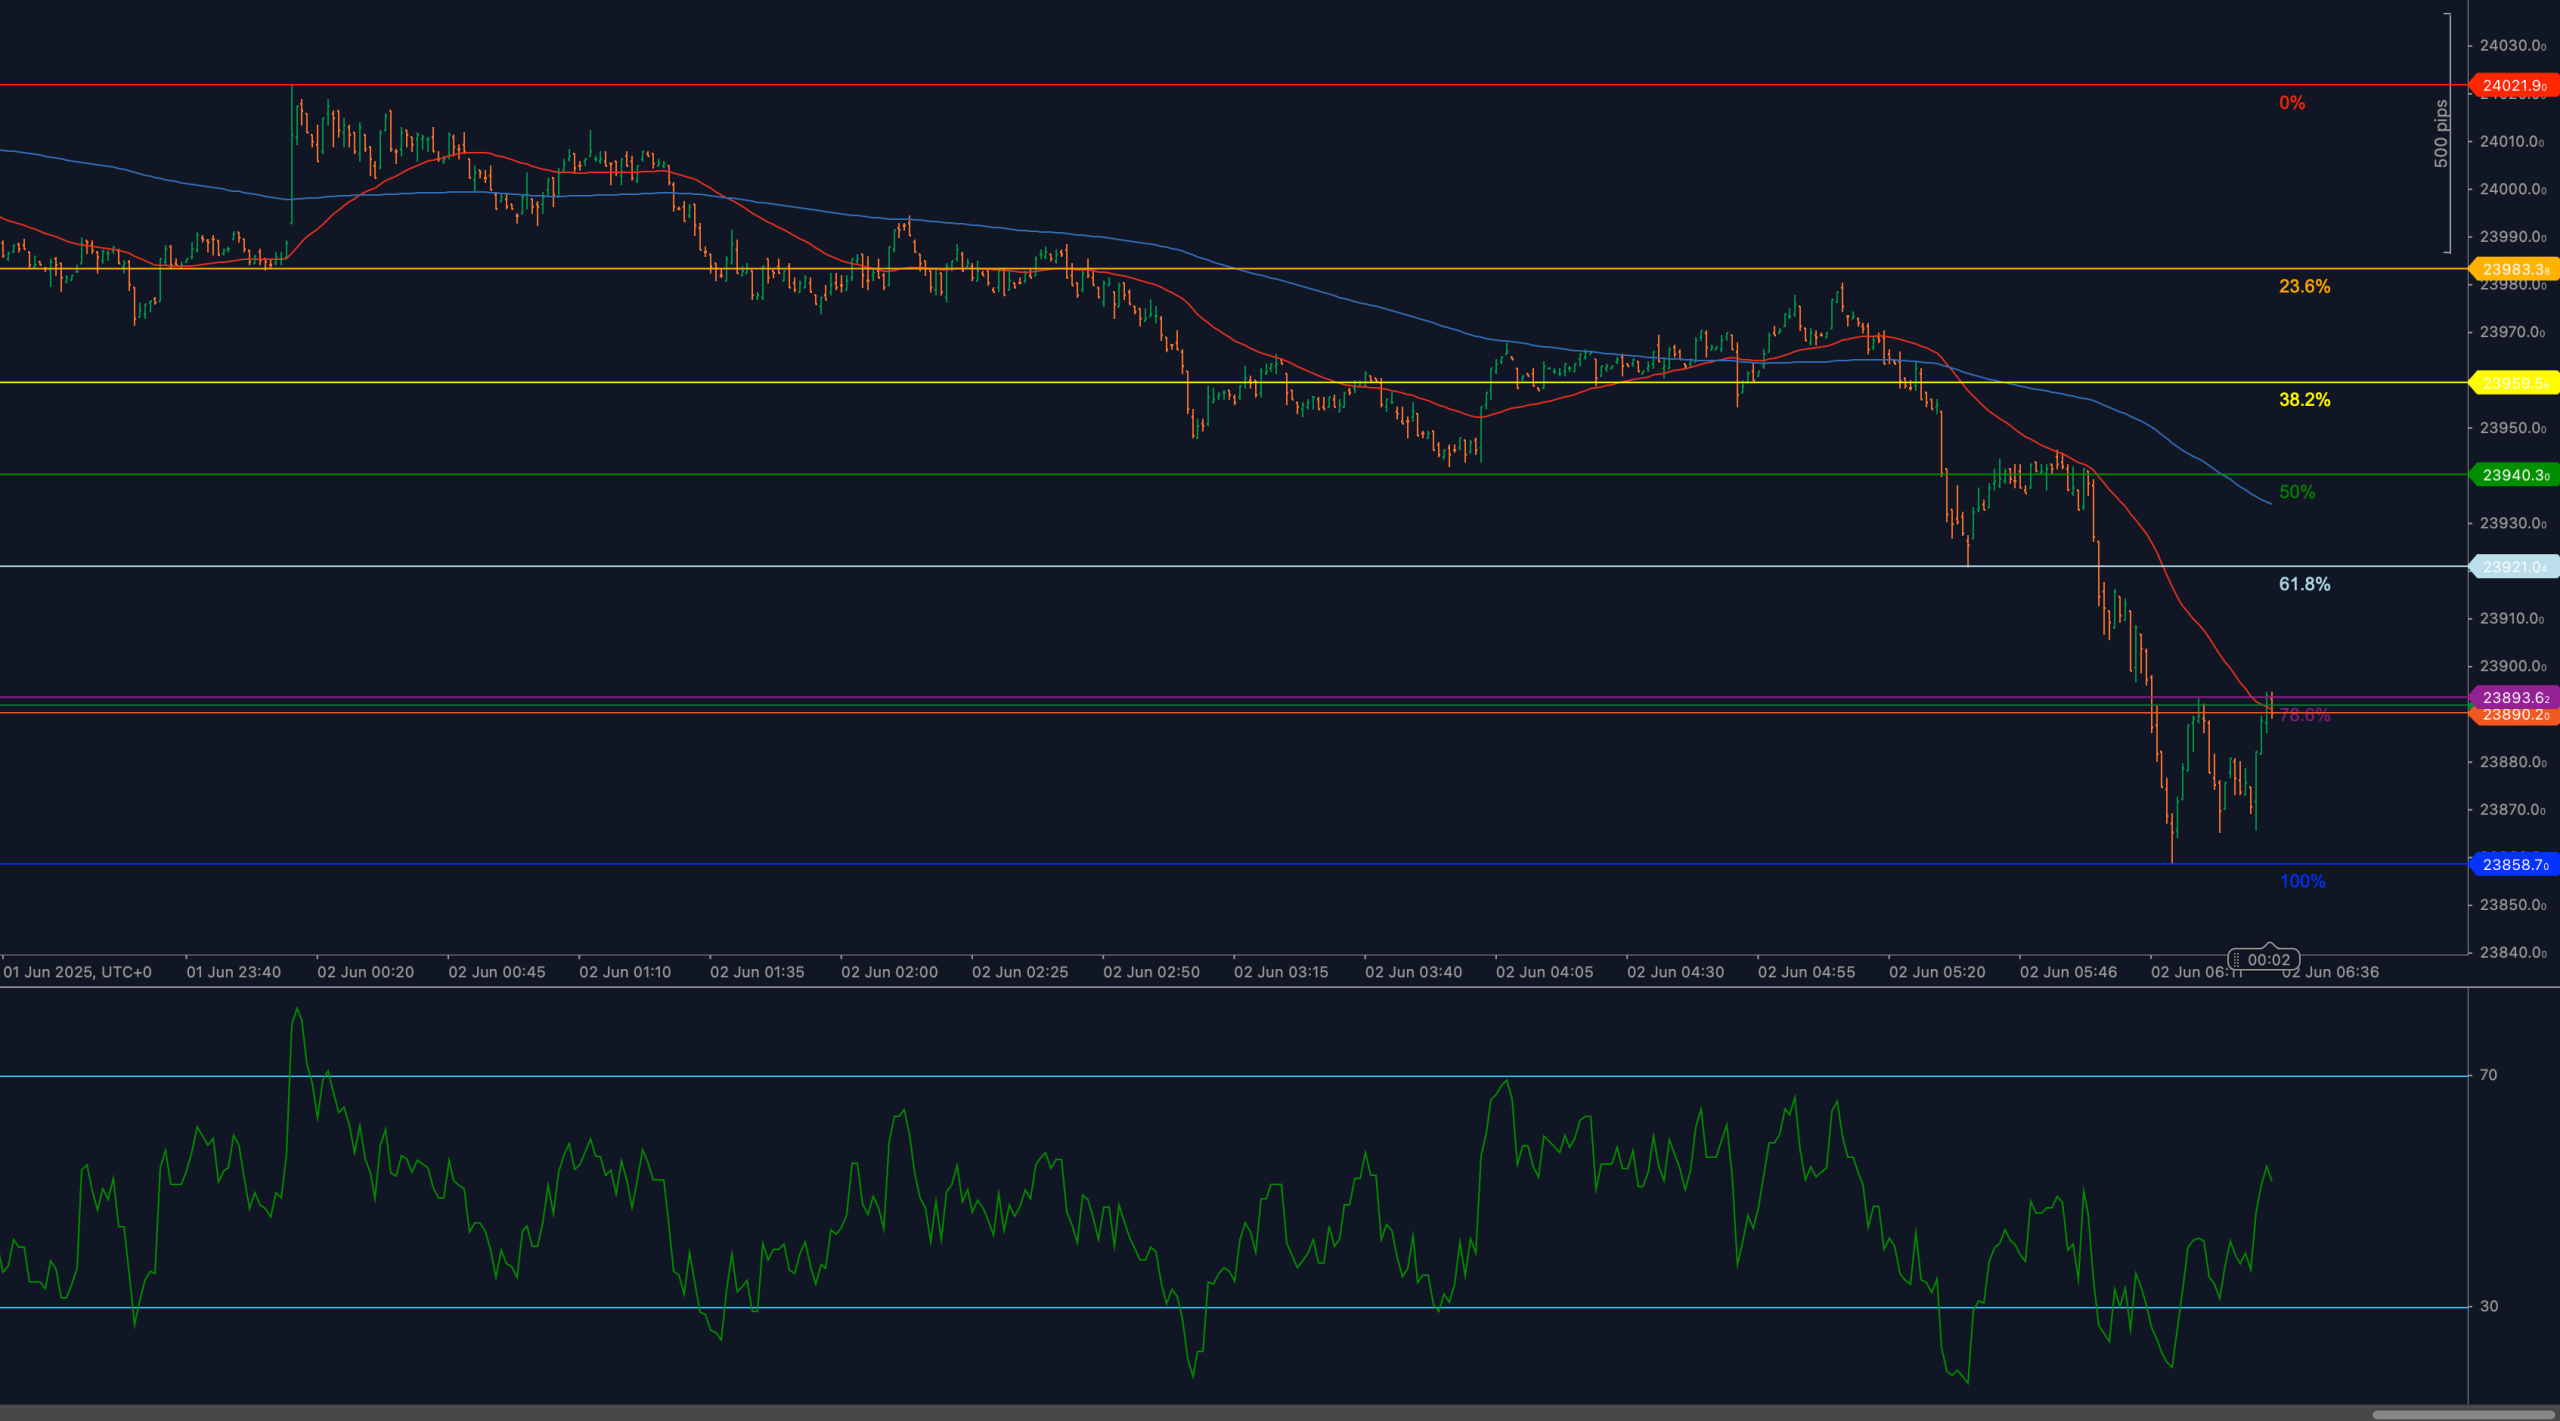
DAX40 staged a partial rebound in early Tuesday trading after a sharp decline that bottomed at 23,858 — the 100% Fibonacci projection of the latest leg down. This level proved pivotal as the index attempted to stabilize and reclaim minor support zones. Price is currently challenging the 78.6% Fibonacci retracement near 23,896, a level that has acted as prior structural support-turned-resistance. While the broader trend remains bearish, short-term sentiment has shifted toward recovery as intraday momentum indicators begin to recover from deeply oversold conditions.
The recent selloff pushed DAX40 well below its 50- and 200-period moving averages, highlighting the strength of the bearish move. However, today’s rebound and the relative strength index (RSI) bouncing back above 40 suggest early signs of stabilization. Traders now watch closely to see if this is a dead-cat bounce or a sustainable base-building phase with potential for broader retracement.
📈 TECHNICAL ANALYSIS
Key Support and Resistance Levels
Resistance has clearly formed at 23,896, where the 78.6% Fibonacci retracement of the latest downleg sits. This level has capped the early bounce and must be overcome to confirm bullish recovery potential. A sustained move above 23,896 would open the path toward the psychological and technical pivot near 23,950, with further upside extending to the 38.2% retracement at 23,955 and the 23.6% retracement at 23,983. The full recovery zone terminates at the 0% mark of 24,021, the origin of the decline.
Support remains at 23,858 — the 100% Fibonacci projection. A failure to hold this level would confirm the continuation of the dominant downtrend and expose the index to deeper retracement zones and potentially a broader corrective phase into prior weekly lows.
Moving Averages and Dynamic Price Action
The index remains suppressed beneath both the 50- and 200-period weighted moving averages, which are currently trending lower and reinforcing the overall bearish environment. The 50-WMA near 23,940 may act as dynamic resistance during any rebound attempt, while the 200-WMA near 23,990 serves as the upper bound for medium-term resistance.
Price action continues to exhibit lower highs and lower lows, though today’s bounce represents the first meaningful challenge to that sequence. To validate a reversal, bulls must drive price above the 50-WMA with momentum and volume support. Otherwise, the current rebound may prove corrective rather than foundational.
RSI Momentum and Bearish Pressure
The 14-period RSI has recovered from deeply oversold conditions and is now hovering just under the neutral 50 level. This recovery reflects easing selling pressure and a return to equilibrium. If RSI can break above 50 and hold, it would bolster the bullish recovery thesis and confirm that momentum has shifted back toward buyers.
Conversely, if RSI stalls below 50 or reverses lower from its current zone, it would signal exhaustion of the rebound and reinforce the underlying bearish structure. The RSI trajectory over the next few sessions will be a critical gauge of sustainability.
Candlestick Behavior and Price Action Clarity
Recent candlesticks illustrate a classic “capitulation-recovery” sequence, with long lower shadows near 23,858 and bullish bodies attempting to reclaim structure. However, the lack of follow-through beyond 23,896 suggests hesitation among bulls. Without a strong bullish close above this level, current candles reflect indecision more than conviction.
To confirm a shift in structure, bulls must generate a large-bodied bullish candle that decisively clears 23,896 and ideally closes above 23,940. Until then, current formations lean neutral-bearish with reactive bounces off support rather than proactive accumulation.
Chart Structure and Breakdown Formation
The overall chart structure remains corrective after a major downside impulse. The failure to hold above the 61.8% retracement at 23,901 initiated a swift drop toward 23,858, marking the completion of a near-full retracement cycle. The rebound into the 78.6% zone is structurally aligned with typical retracement behavior but lacks confirmation for trend reversal.
If price continues to stall at 23,896 and cannot reclaim dynamic resistance near the MAs, the structure remains vulnerable to another leg lower — potentially toward deeper Fibonacci projection zones. A close back above 23,955 would neutralize this setup and favor short-term range expansion.
Fibonacci Retracement and Extension Levels
The current retracement is measured from the swing high at 24,021 to the low at 23,858. Price has already tested the 100% projection level and is now battling to reclaim the 78.6% retracement at 23,896. A break above this level would bring 23,940 (50% mark) and 23,955 (38.2%) into focus as intermediate resistance levels. Continuation beyond these would challenge 23,983 (23.6%) and full retracement at 24,021.
Failure to clear 23,896 reinforces the bear case, with 23,858 acting as a trigger for potential downside extension. A confirmed breakdown below that would reopen bearish targets toward sub-23,800 territory in the days ahead.
🔍 MARKET OUTLOOK & TRADING SCENARIOS
Bullish Scenario
A break and close above 23,896, followed by RSI crossing 50, would signal bullish reengagement. Further confirmation comes with a move above 23,940–23,955. In this case, 23,983 and 24,021 become viable upside targets.
Neutral Scenario
Price fluctuates between 23,858 and 23,896 while RSI hovers in the 45–50 range, indicating consolidation without conviction. This scenario suggests indecision and may precede either a breakout or breakdown depending on broader sentiment.
Bearish Scenario
A failure at 23,896 followed by a return below 23,858 would confirm bearish continuation. RSI rolling over from 50 would support the case for a new impulsive move lower, with next downside targets below 23,800.
💼 TRADING CONSIDERATIONS
Traders favoring trend continuation may look for short setups on rejection from 23,896 with RSI confirmation. Stops may be placed above 23,940, while downside targets include 23,858 and lower. Bullish setups require confirmation of breakout above resistance and RSI strength, with opportunities to scale into positions targeting 23,955–24,021.
🏁 CONCLUSION
DAX40 has recovered from the 100% projection low at 23,858 but now faces critical resistance at 23,896 — the 78.6% retracement. RSI is attempting to rebound, and candles show early signs of demand. However, the structure remains fragile beneath major moving averages. A decisive move above 23,896 would pave the way for extended recovery, while failure at this zone will keep the bearish bias intact.
⚠️ DISCLAIMER
This analysis is for informational purposes only and does not constitute financial advice. Always consult with a licensed financial professional before making trading decisions.


