
📊 MARKET OVERVIEW
The German DAX40 index has lost its bullish momentum after an early-May surge toward 23,956, now trading sideways within a volatile and indecisive range. Price is hovering beneath the 38.2% Fibonacci retracement at 23,566, derived from the May 6 low near 23,062 to the May 13 high. While the market rebounded aggressively following the May 10 dip, bulls have since failed to maintain directional control, and the broader setup is beginning to reflect uncertainty and exhaustion.
This technical hesitation coincides with a mixed global macro backdrop. German CPI remains sticky, while manufacturing sentiment is subdued. Meanwhile, global equities face headwinds from U.S. yields, commodity volatility, and cautious central bank rhetoric. As such, traders are rotating out of high-beta exposure, leading to fragmented flows across European indices.
Technically, the DAX remains within a holding pattern that could break in either direction. Buyers must reclaim 23,566 and ultimately 23,721 to regain directional advantage. Otherwise, the risk of a renewed drop into the 23,390–23,060 zone remains elevated.
📈 TECHNICAL ANALYSIS
Key Support and Resistance Levels
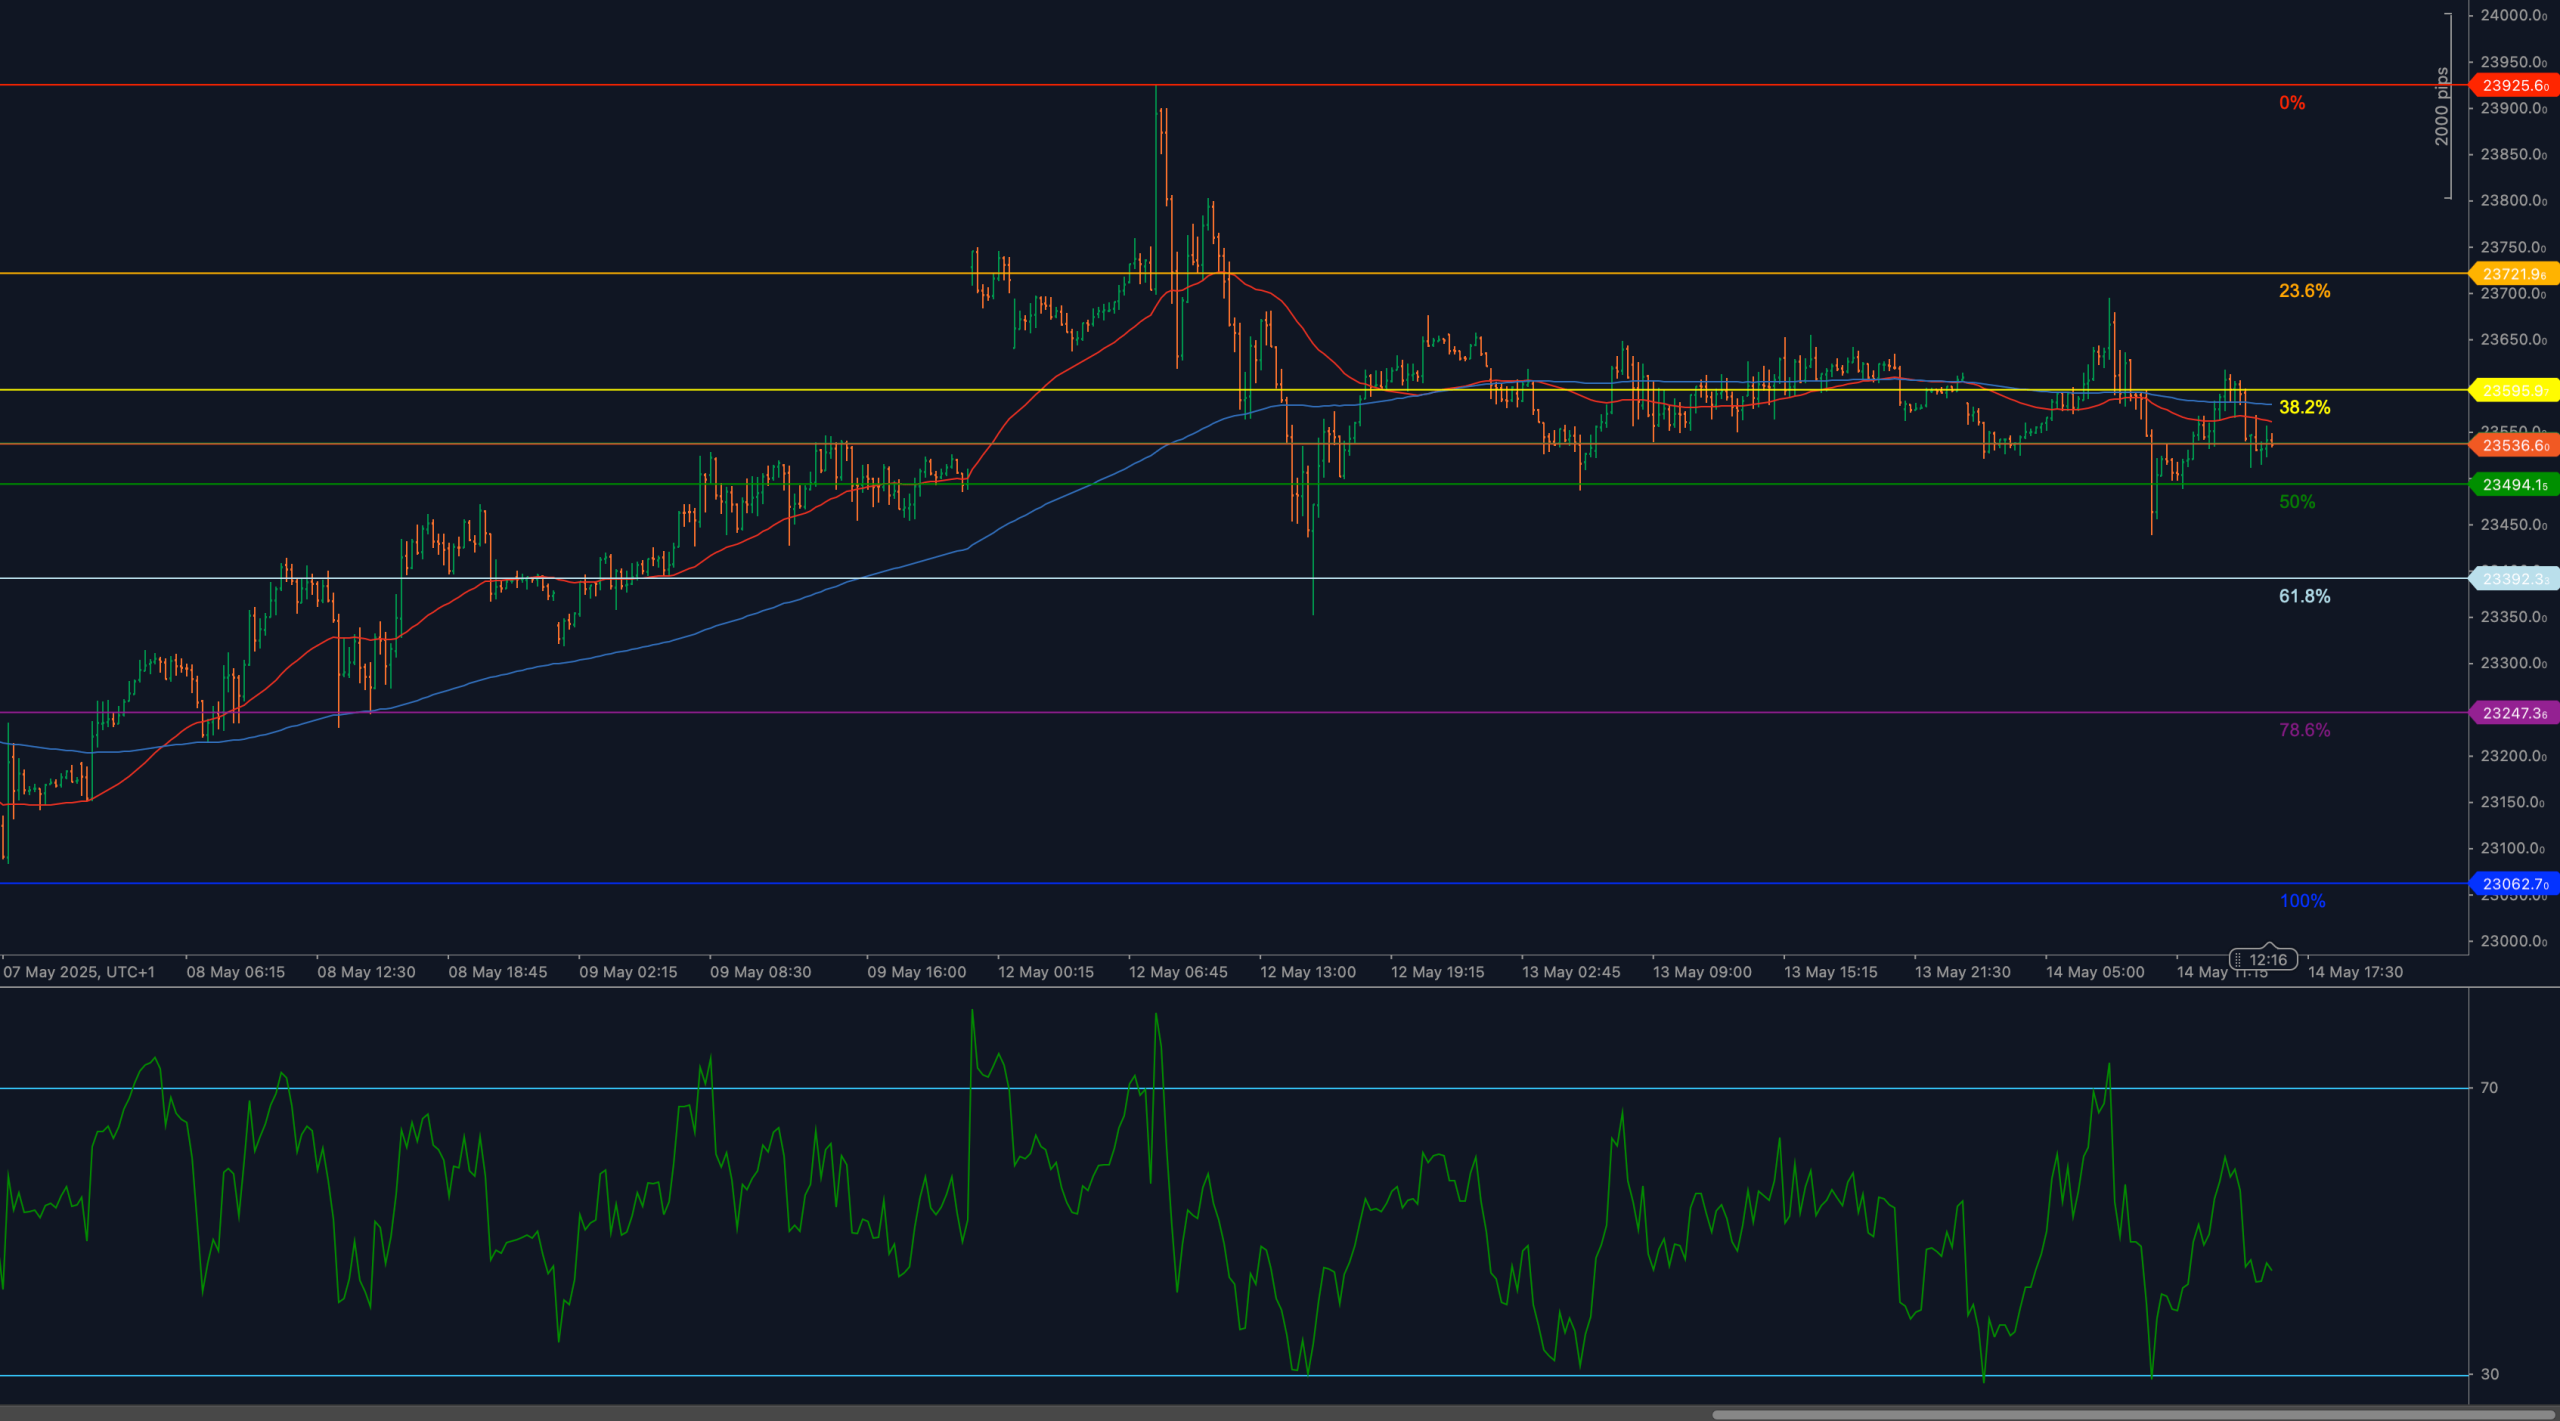
Resistance is well defined at 23,566, where the 38.2% Fibonacci retracement of the recent impulse leg intersects with a prior congestion cluster. The next significant upside test is 23,721, the 23.6% retracement and last failed breakout level. A close above 23,721 would restore technical strength and target a potential return to 23,956 and beyond.
Support remains at 23,494, corresponding to the 50% retracement, followed by 23,392 (61.8%), a key confluence level where price previously reversed. A breakdown through this level would indicate failed recovery and expose deeper corrective targets at 23,247 and 23,062 — the 78.6% and 100% retracements, respectively.
Moving Averages and Dynamic Price Action
Price is currently oscillating around both the 50-period and 200-period weighted moving averages, with the 50-WMA beginning to roll downward and the 200-WMA flattening — a sign of trend fatigue. This alignment reflects short-term indecision and lack of conviction on either side.
The lack of consistent closes above the 200-WMA suggests sellers continue to fade strength near resistance. Meanwhile, the 50-WMA now serves as a reaction point for short-term traders, with multiple tests indicating growing pressure. For momentum to re-emerge, price must break free from this compression zone decisively.
RSI Momentum and Market Pressure
The 14-period RSI has remained erratic, oscillating between 40 and 60 with no sustained movement into overbought or oversold territory. This behavior is consistent with range-bound trading and a lack of strong participation. While RSI briefly spiked above 65 during the May 13 surge, it has since dropped sharply, suggesting that bullish energy has faded.
A move back above 60–65 would be necessary to support breakout potential. Conversely, if RSI breaks and holds below 45, it would confirm renewed bearish pressure and likely coincide with a push toward the 61.8% or 78.6% retracement zones.
Candlestick Behavior and Price Action Clarity
Recent candles exhibit significant upper wicks and shallow closes, signaling rejection near local highs. Several intraday reversals have occurred near 23,566, emphasizing its importance as a resistance barrier. Additionally, lack of follow-through after bullish candles points to fading conviction and trapped buying interest.
Price remains trapped within a range of overlapping candle bodies, with no breakout structure or exhaustion signals. For directional clarity to emerge, traders will need a strong-bodied candle with above-average range and a close beyond either 23,566 or 23,392.
Chart Structure and Breakout Formation
The broader structure is beginning to resemble a symmetrical triangle or a coiling wedge, as lower highs and higher lows compress within the 200-point range. This price behavior typically precedes a breakout — but the direction remains undefined.
Volume metrics (not visible here) would confirm participation, but from the price-action alone, this range appears unsustainable. If bulls break above 23,721, it would confirm a bullish continuation pattern. If price falls below 23,392, the entire May rebound risks unraveling.
Fibonacci Retracement and Extension Levels
The Fibonacci grid from 23,062 to 23,956 defines the current structure. Price has repeatedly tested the 38.2% retracement at 23,566 without success. Below that, the 50% retracement at 23,494 and 61.8% at 23,392 form the base of short-term support. These levels will act as crucial buffers for trend continuation or breakdown confirmation.
If 23,566 is cleared, traders will target 23,721, followed by a return to 23,956, the local high. Breakout extensions above that may reach 24,120+, depending on follow-through strength.
🔍 MARKET OUTLOOK & TRADING SCENARIOS
Bullish Scenario
If price closes above 23,566, with RSI reclaiming 60+ and momentum building, the index could retest 23,721 and potentially move back toward the 23,956 high. A confirmed breakout would require strong candle close and rising volume.
Neutral Scenario
Continued oscillation between 23,390 and 23,566, with RSI chopping between 45–55, would indicate prolonged indecision. Traders should wait for resolution above resistance or below key supports before engaging.
Bearish Scenario
A failure at 23,494, followed by a breakdown through 23,392, would confirm bearish reentry. RSI under 45 would support the shift. Downside targets would include 23,247, and then the full retracement at 23,062, especially if broader indices correct.
💼 TRADING CONSIDERATIONS
Short-term bias remains neutral with a bearish tilt while price holds below 23,566. Breakout trades above 23,721 may favor bulls, with stop placements beneath 23,494. Bears can re-engage on rejection candles near resistance or confirmed breakdowns below 23,392.
🏁 CONCLUSION
DAX40 is range-bound beneath 23,566, with RSI unstable, candles lacking commitment, and moving averages flattening. Bulls must reclaim the 23.721 breakout zone to resume upward momentum. Otherwise, fading structure and technical pressure may drive a deeper retracement into the 23,390–23,060 support corridor. Until breakout or breakdown occurs, volatility within range remains the dominant condition.
⚠️ DISCLAIMER
This analysis is for informational purposes only and does not constitute financial advice. Always consult with a licensed financial professional before making trading decisions.


