
📊 MARKET OVERVIEW
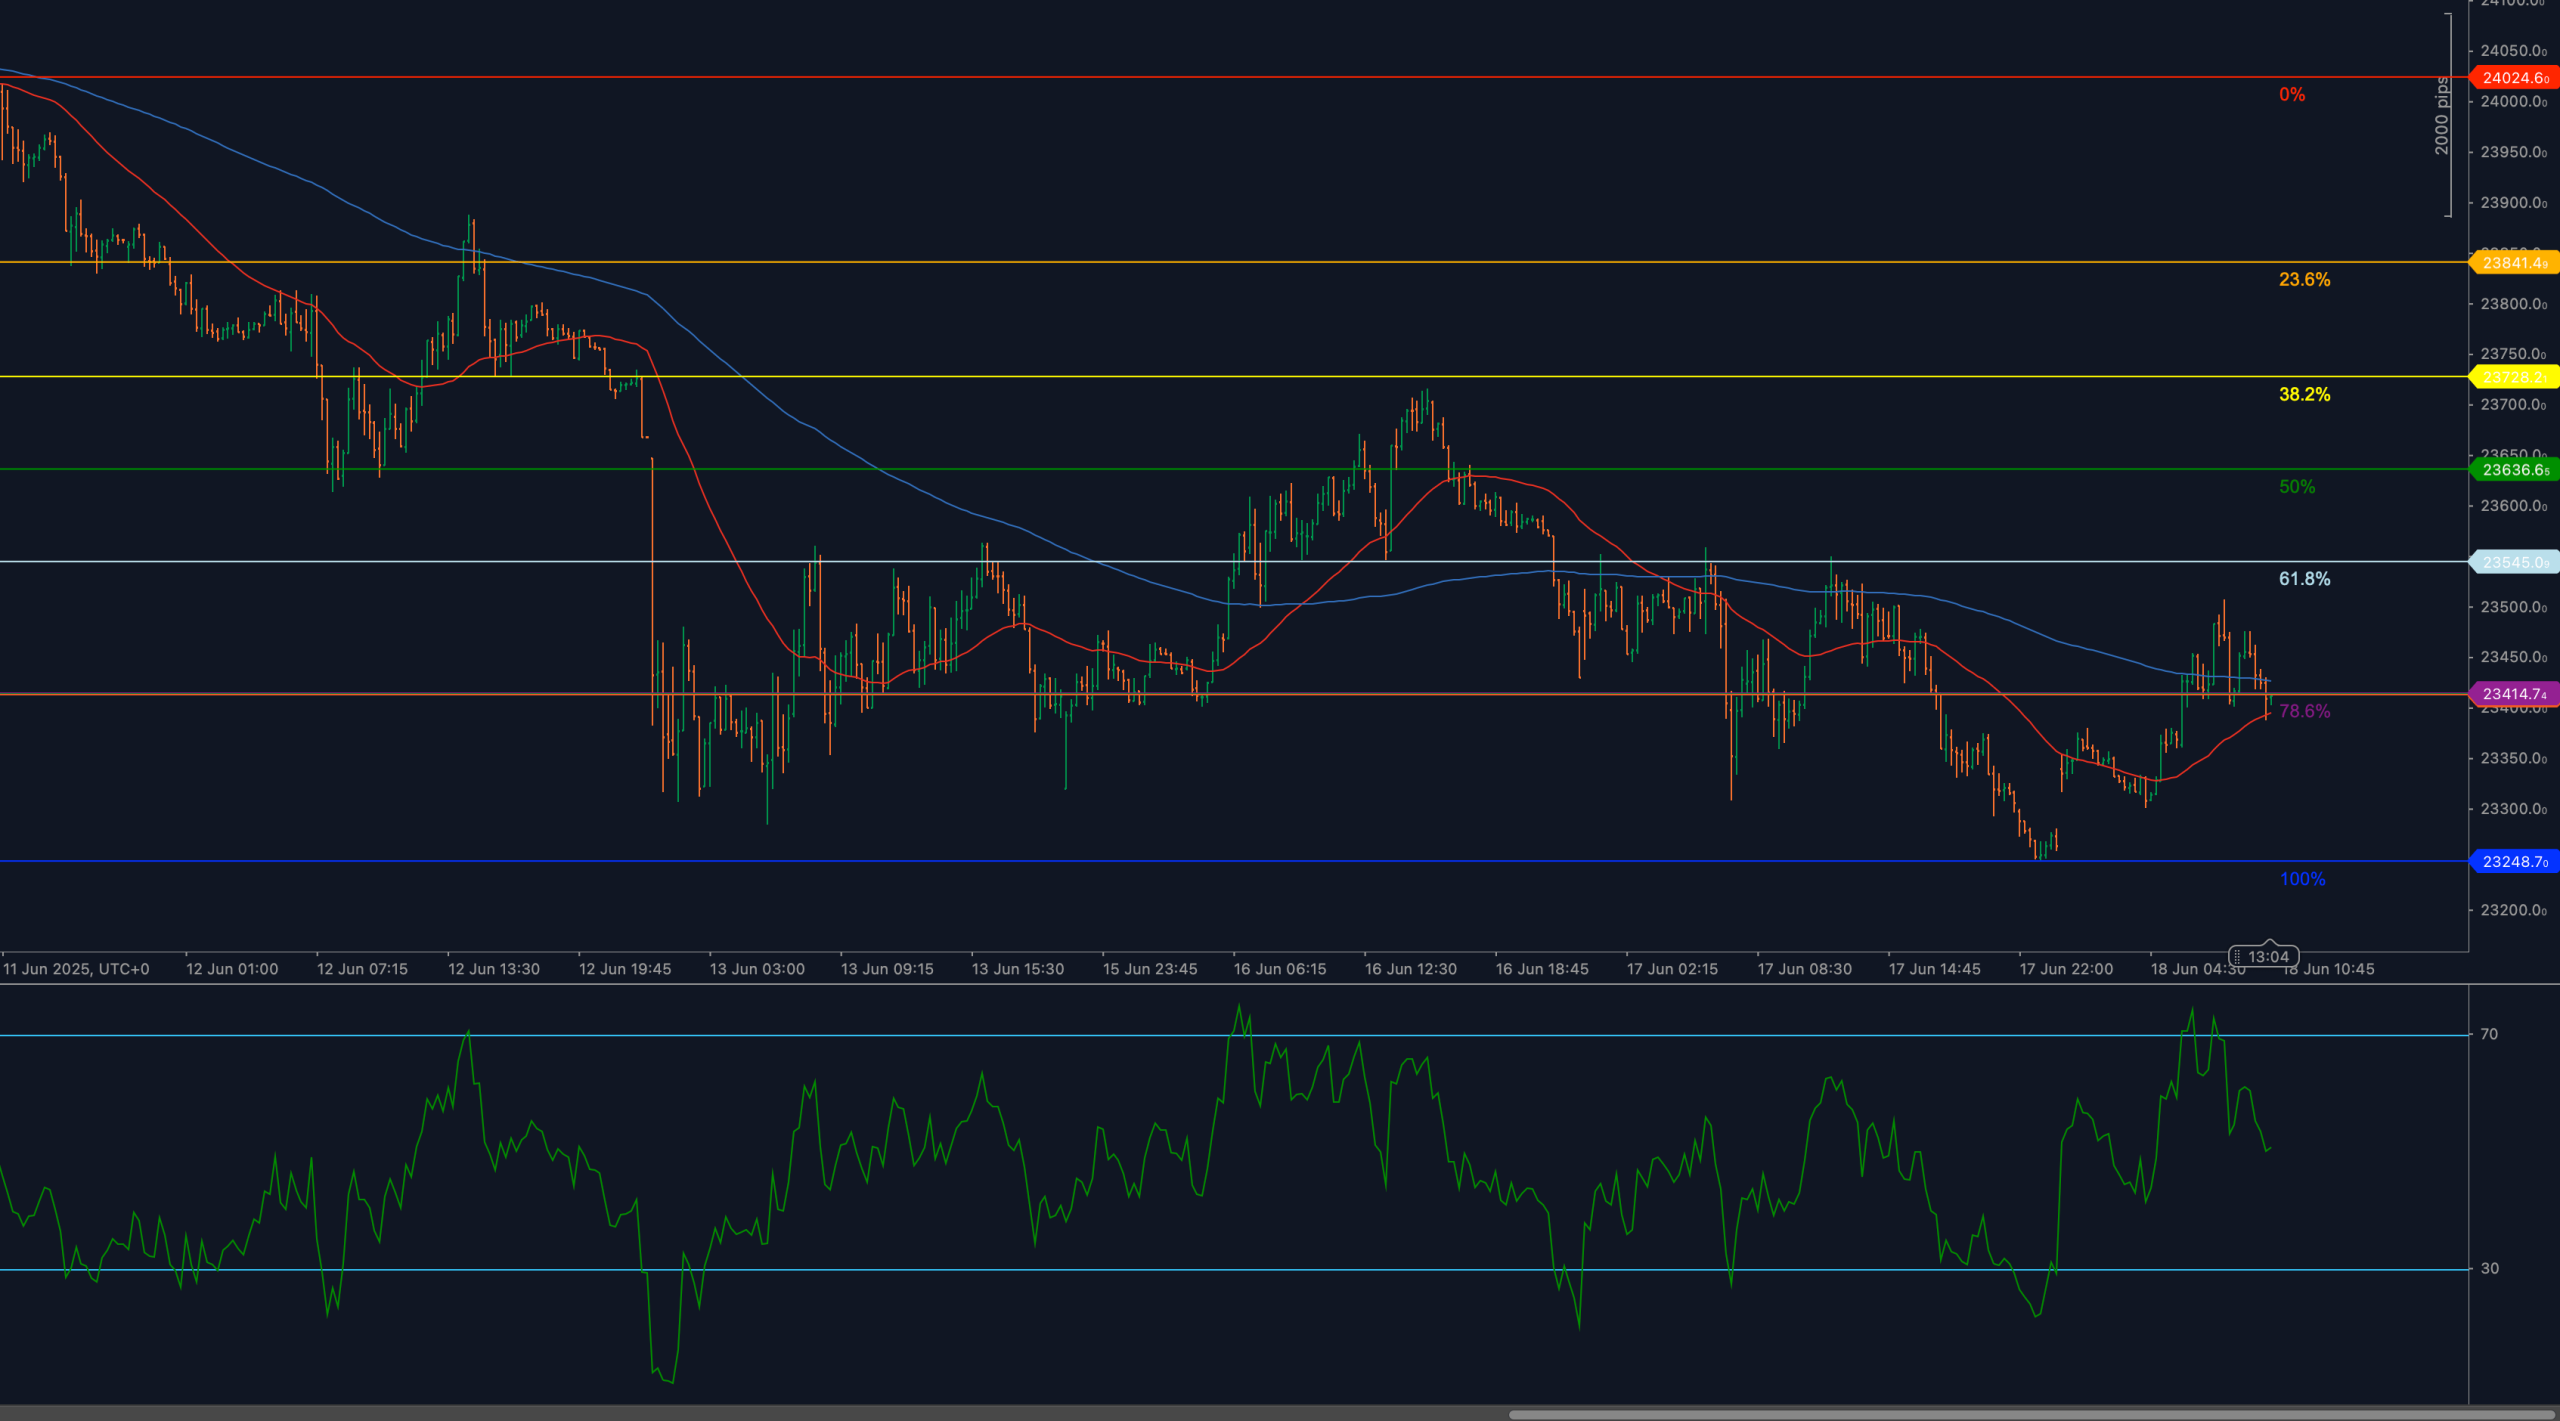
DAX40 has staged a moderate rebound from the recent low near 23,248, but upward momentum is now fading as price approaches the critical 61.8% Fibonacci retracement at 23,546. The index remains capped below the descending 200-period moving average, highlighting ongoing bearish control over the broader trend.
RSI has turned lower after testing overbought territory, signaling waning bullish strength. Unless DAX40 can break decisively above 23,546 and the key moving averages, this rebound may transition into another corrective leg. Traders now turn their attention to potential reaction zones near 23,417 and 23,248.
📈 TECHNICAL ANALYSIS
Key Support and Resistance Levels
Immediate resistance is marked by the 61.8% Fibonacci retracement at 23,546, which has already produced a pullback. A breakout above this level would target 23,728 (38.2%) and potentially 23,841 (23.6%).
To the downside, key support rests at 23,417 (78.6% Fib), followed by the prior reaction low and full retracement near 23,248. These levels will be critical in determining whether bulls can maintain control or if bears will regain dominance.
Moving Averages and Dynamic Price Action
The index is currently battling with both the 50-period and 200-period Weighted Moving Averages, which converge near the 23,500–23,546 zone. The 200-WMA continues to slope lower, reinforcing the broader bearish trend, while the 50-WMA remains neutral.
Until price can close firmly above this moving average cluster, bullish momentum is likely to remain constrained. Failure to hold above 23,417 would tilt the bias back toward sellers.
RSI Momentum and Bearish Pressure
The 14-period RSI surged near 65, but has since rolled over and now trends lower. The loss of bullish momentum is consistent with price rejection near the 61.8% Fib level.
Without a strong RSI rebound, further corrective pressure remains likely. A move below 50 would confirm deeper retracement potential, while only a return above 60 would suggest renewed buying interest.
Candlestick Behavior and Price Action Clarity
Recent candles show upper wicks forming near 23,546, reflecting profit-taking and hesitation among buyers. No bullish engulfing patterns have emerged to suggest breakout potential.
Unless a strong bullish candle clears 23,546 with momentum, the current setup favors consolidation or renewed decline.
Chart Structure and Breakdown Formation
The current chart structure reflects a bearish retracement rally within a larger downtrend. The rebound from 23,248lacks impulsive strength, with price struggling to overcome dynamic resistance.
If the index fails to sustain above 23,417, it may retest 23,248, aligning with a potential descending channel structure. A deeper breakdown could develop if this key floor gives way.
Fibonacci Retracement and Extension Levels
The retracement from 24,024 (June 11 high) to 23,248 (June 12 low) defines the key levels in play. The 61.8% level at 23,546 remains a pivotal barrier. Sustained rejection here favors another leg lower toward 23,417 and 23,248.
If bulls reclaim 23,728, a deeper retracement toward 23,841 may follow. For now, the Fibonacci structure favors the downside unless clear breakout signals emerge.
🔍 MARKET OUTLOOK & TRADING SCENARIOS
Bullish Scenario
A sustained breakout above 23,546 with RSI climbing back above 60 could trigger an advance toward 23,728 and 23,841. The bullish case requires strong follow-through to negate current downside risks.
Neutral Scenario
A sideways range between 23,417–23,546 may develop if bulls defend support but lack breakout momentum. RSI holding between 50–55 would align with consolidation.
Bearish Scenario
A break below 23,417 and especially 23,248 would confirm bearish continuation. RSI falling under 45 would validate this view and expose further downside risk.
💼 TRADING CONSIDERATIONS
Bullish setup: Watch for breakout signals above 23,546 with RSI support. Targets: 23,728, 23,841. Stops below 23,417.
Bearish setup: Short on rejection of 23,546 or breakdown below 23,417. Targets: 23,248. Stops above 23,546.
Risk context: RSI softening and resistance zone rejection suggest caution on long entries until clearer breakout confirmation.
🏁 CONCLUSION
DAX40 rebound is stalling below key resistance at 23,546. Unless bulls reclaim this level with strong momentum, risk remains skewed toward renewed downside targeting 23,417 and 23,248. RSI trends lower, and moving average structure continues to favor a cautious approach for buyers.
⚠️ DISCLAIMER
This analysis is for informational purposes only and does not constitute financial advice. Always consult with a licensed financial professional before making trading decisions.


