
📊 MARKET OVERVIEW
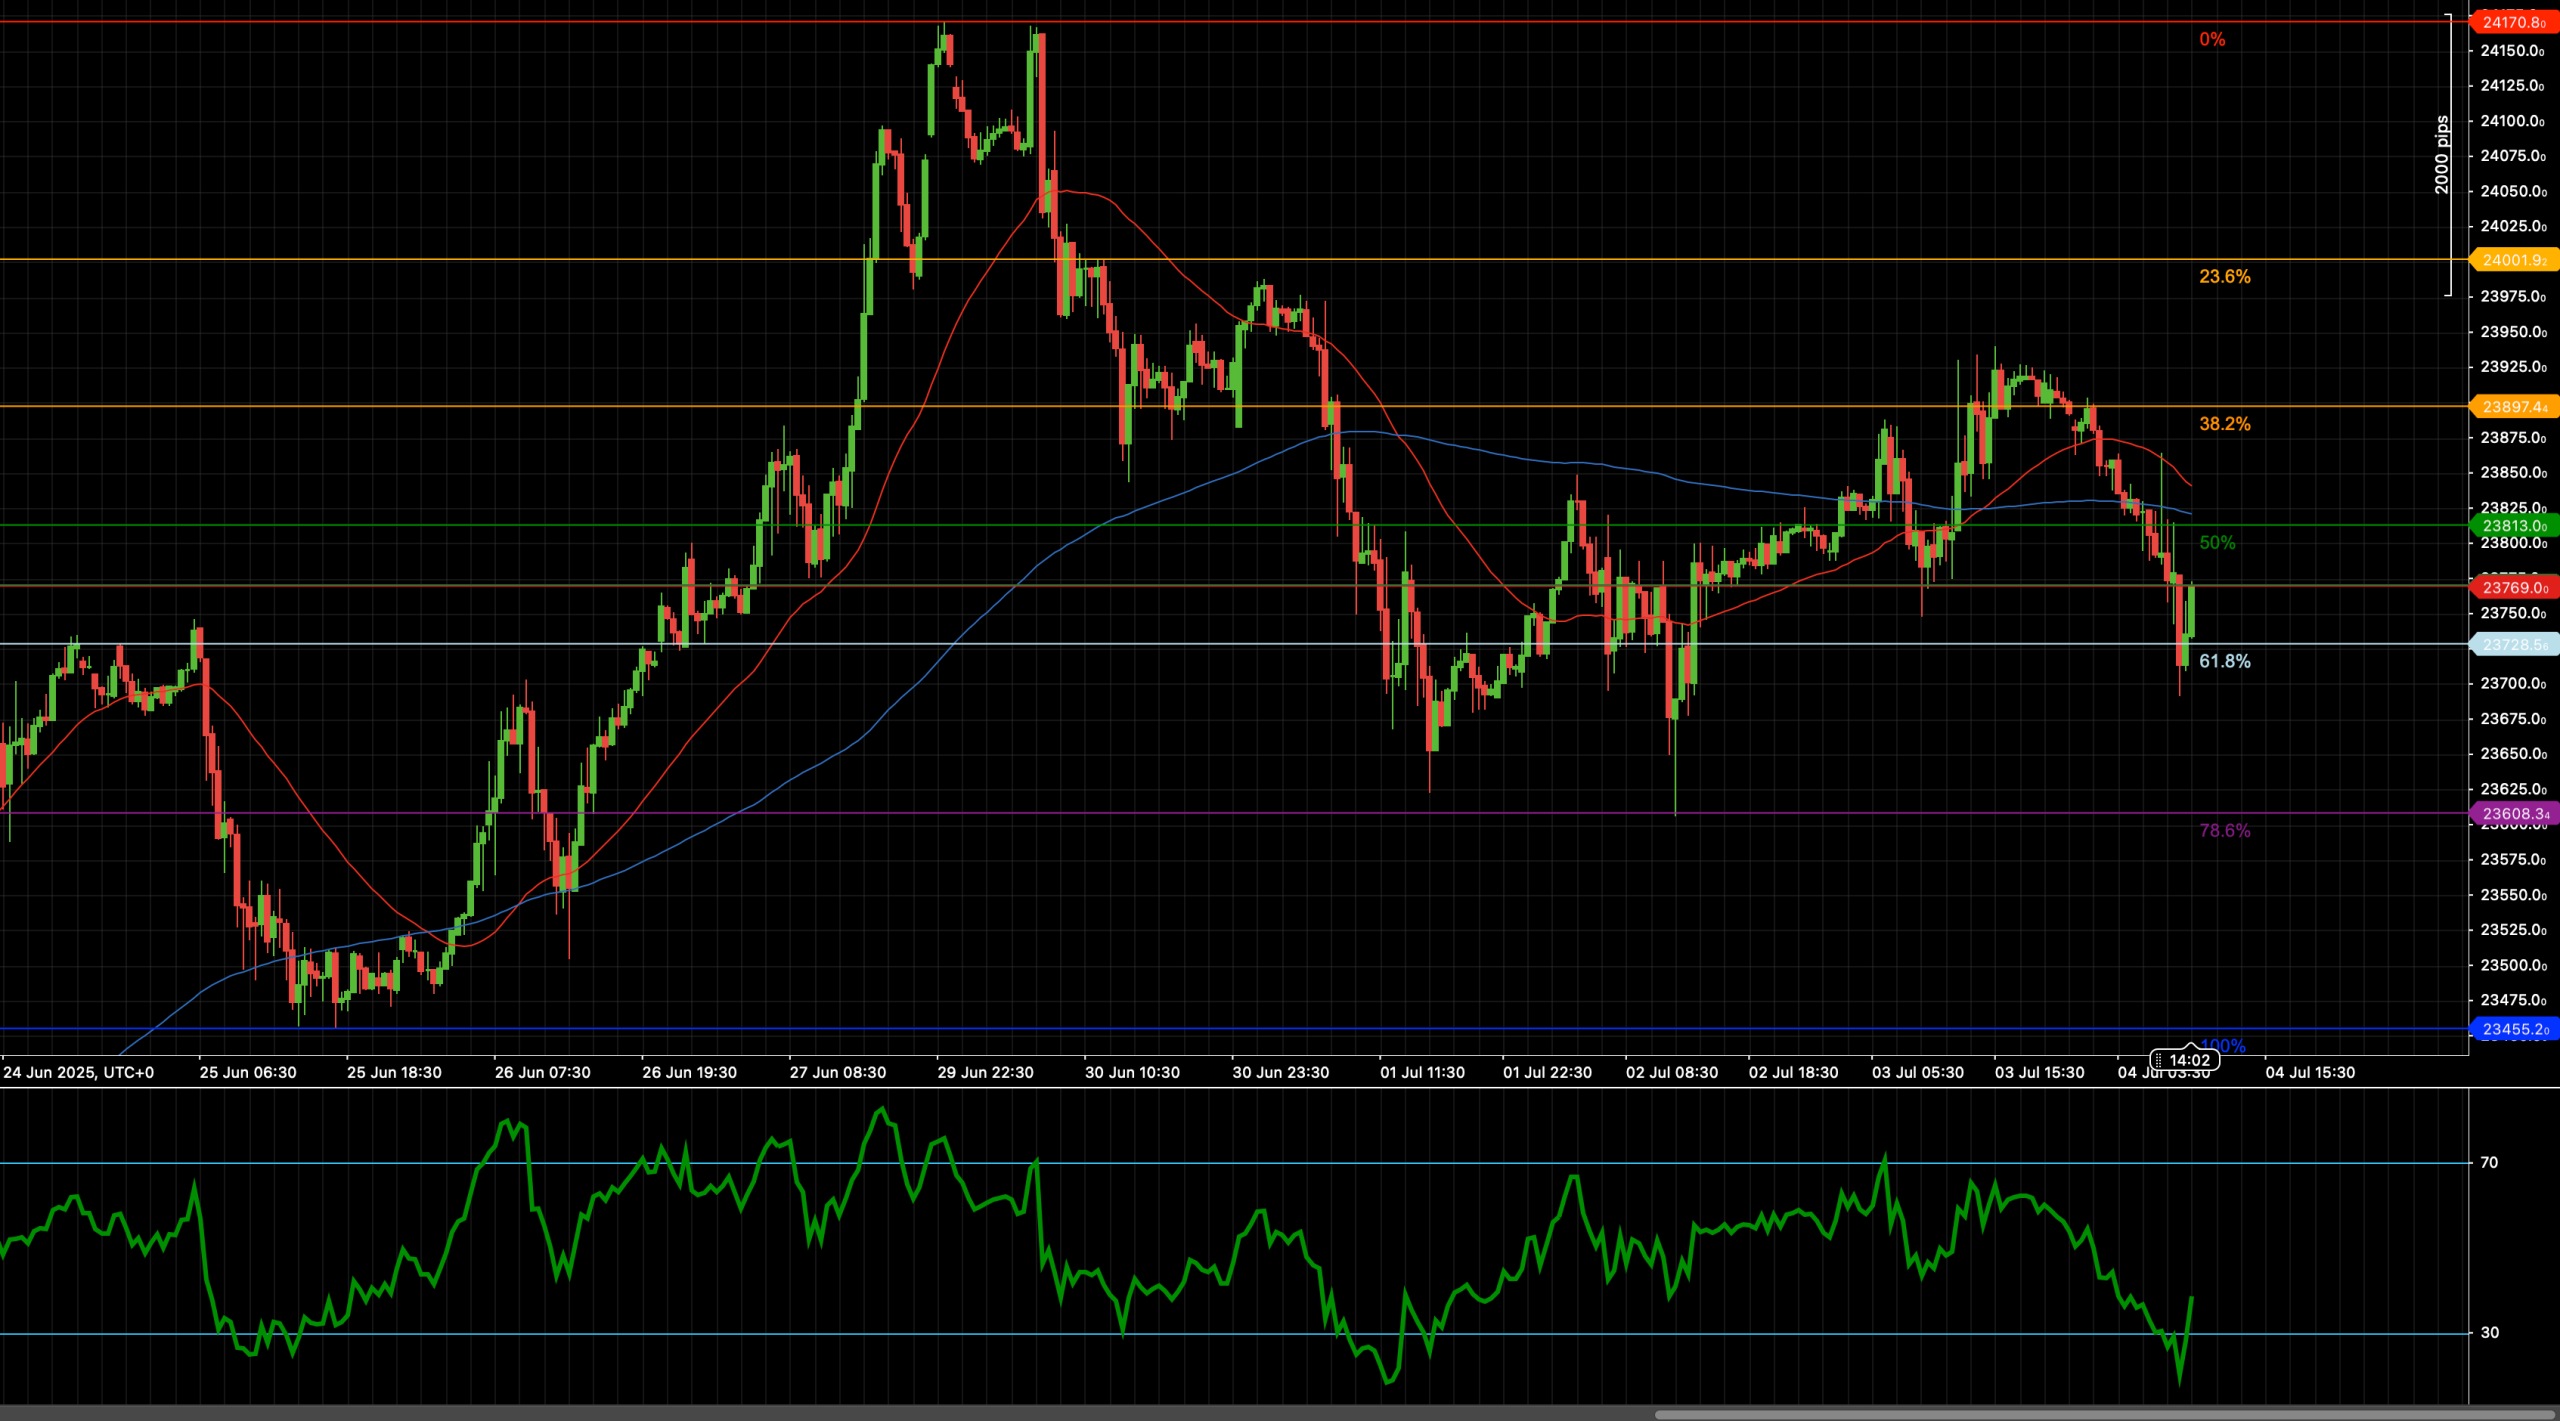
DAX40 suffered a sharp pullback from its recent high near 24,170, with sellers quickly driving the index below several key support levels. The drop retraced more than 61.8% of the prior June–July rally, with prices stabilizing near 23,760, a critical Fibonacci level. This move reflects rising volatility as markets digest macroeconomic uncertainty and shifting risk sentiment in European equities. RSI dipped below the oversold 30 threshold during the drop but is showing tentative signs of recovery, suggesting that bearish momentum may be stalling. As long as 23,760 holds, the broader uptrend could resume, though buyers will need to clear 23,970 and 24,010 to regain momentum.
📈 TECHNICAL ANALYSIS
Key Support and Resistance Levels
Immediate support lies at 23,760, the 61.8% Fibonacci retracement of the June advance. Below this, the next critical level is the 23,600 horizontal support zone, followed by deeper protection at 23,460, near the 78.6% retracement. On the upside, resistance aligns at 23,970, where the price previously consolidated, and then at 24,010, near the 50% retracement. A breakout above 24,010 could open the way for a retest of 24,170, the prior peak.
Moving Averages and Dynamic Price Action
Price has fallen below both the 50- and 200-period weighted moving averages, now acting as resistance zones. The 200-WMA is flattening near 23,880, while the 50-WMA is declining, reflecting short-term bearish pressure. To regain bullish footing, DAX40 would need to reclaim the 200-WMA and hold above it. For now, the moving averages reflect a cautious stance, and further price action near these levels will define the next trend phase.
RSI Momentum and Trend Strength
The 14-period RSI broke below the oversold 30 level during the selloff, reflecting intense bearish momentum. However, the indicator has since bounced modestly, suggesting a short-term relief rally may unfold if price holds above support. A further RSI rise above 40 would confirm improving sentiment, while another dip below 30 would reignite bearish pressure.
Candlestick Structure and Market Tone
Recent candlestick patterns show sharp bearish impulses followed by small-bodied candles near support, indicating reduced selling pressure. No clear bullish reversal patterns have formed yet, though stabilization at 23,760 suggests buyer interest. A bullish engulfing pattern or long-tailed reversal candle above 23,970 would provide confirmation of a short-term bottom.
Chart Structure and Trend Integrity
The broader DAX40 trend remains mixed. While the index had been making higher highs and higher lows since June, the sharp drop below the 200-WMA challenges the medium-term bullish structure. Holding 23,760 is essential to preserve the uptrend bias. A break below 23,600 would turn the outlook neutral-bearish, opening the door to a deeper correction.
Fibonacci Roadmap and Target Zones
The Fibonacci retracement from the June low to the 24,170 high highlights 23,760 (61.8%) as the key support level. Should the index bounce from here, targets lie at 23,970 (50% retracement) and 24,010. On the downside, a break below 23,760 could trigger a move to the 78.6% retracement at 23,460, followed by the prior swing low near 23,450.
🔍 MARKET OUTLOOK & TRADING SCENARIOS
Bullish Scenario
A rebound above 23,970, ideally accompanied by an RSI rise above 45, would signal recovery. A sustained break over 24,010 would target 24,170, restoring the broader bullish outlook.
Neutral Scenario
If DAX40 remains between 23,600 and 23,970, price action likely stays choppy and indecisive. RSI hovering between 35 and 45 would reflect this range-bound tone, favoring short-term traders.
Bearish Scenario
A clear break below 23,760, particularly if RSI slips back below 30, would confirm bearish continuation. Downside targets include 23,600, then 23,460, representing the next Fibonacci and horizontal supports.
💼 TRADING CONSIDERATIONS
• Bullish setup: Buy rebound above 23,970, targeting 24,010 and 24,170. Stop loss below 23,760.
• Bearish setup: Sell breakdown below 23,760, targeting 23,600 and 23,460. Stop above 23,970.
• Range play: Fade 23,600–23,970 zone with tight stops and confirmation from RSI/price patterns.
🏁 CONCLUSION
DAX40 faces a key test at 23,760 after a sharp pullback from its recent highs. As long as this support holds, a rebound toward 23,970 and 24,010 remains plausible. A break below 23,760 would expose the index to deeper downside risks toward 23,600 and 23,460. Traders should closely monitor RSI momentum and price behavior near these critical levels.
⚠️ DISCLAIMER
This analysis is for informational purposes only and does not constitute financial advice. Always consult a licensed financial advisor before making investment decisions.


