
📊 MARKET OVERVIEW
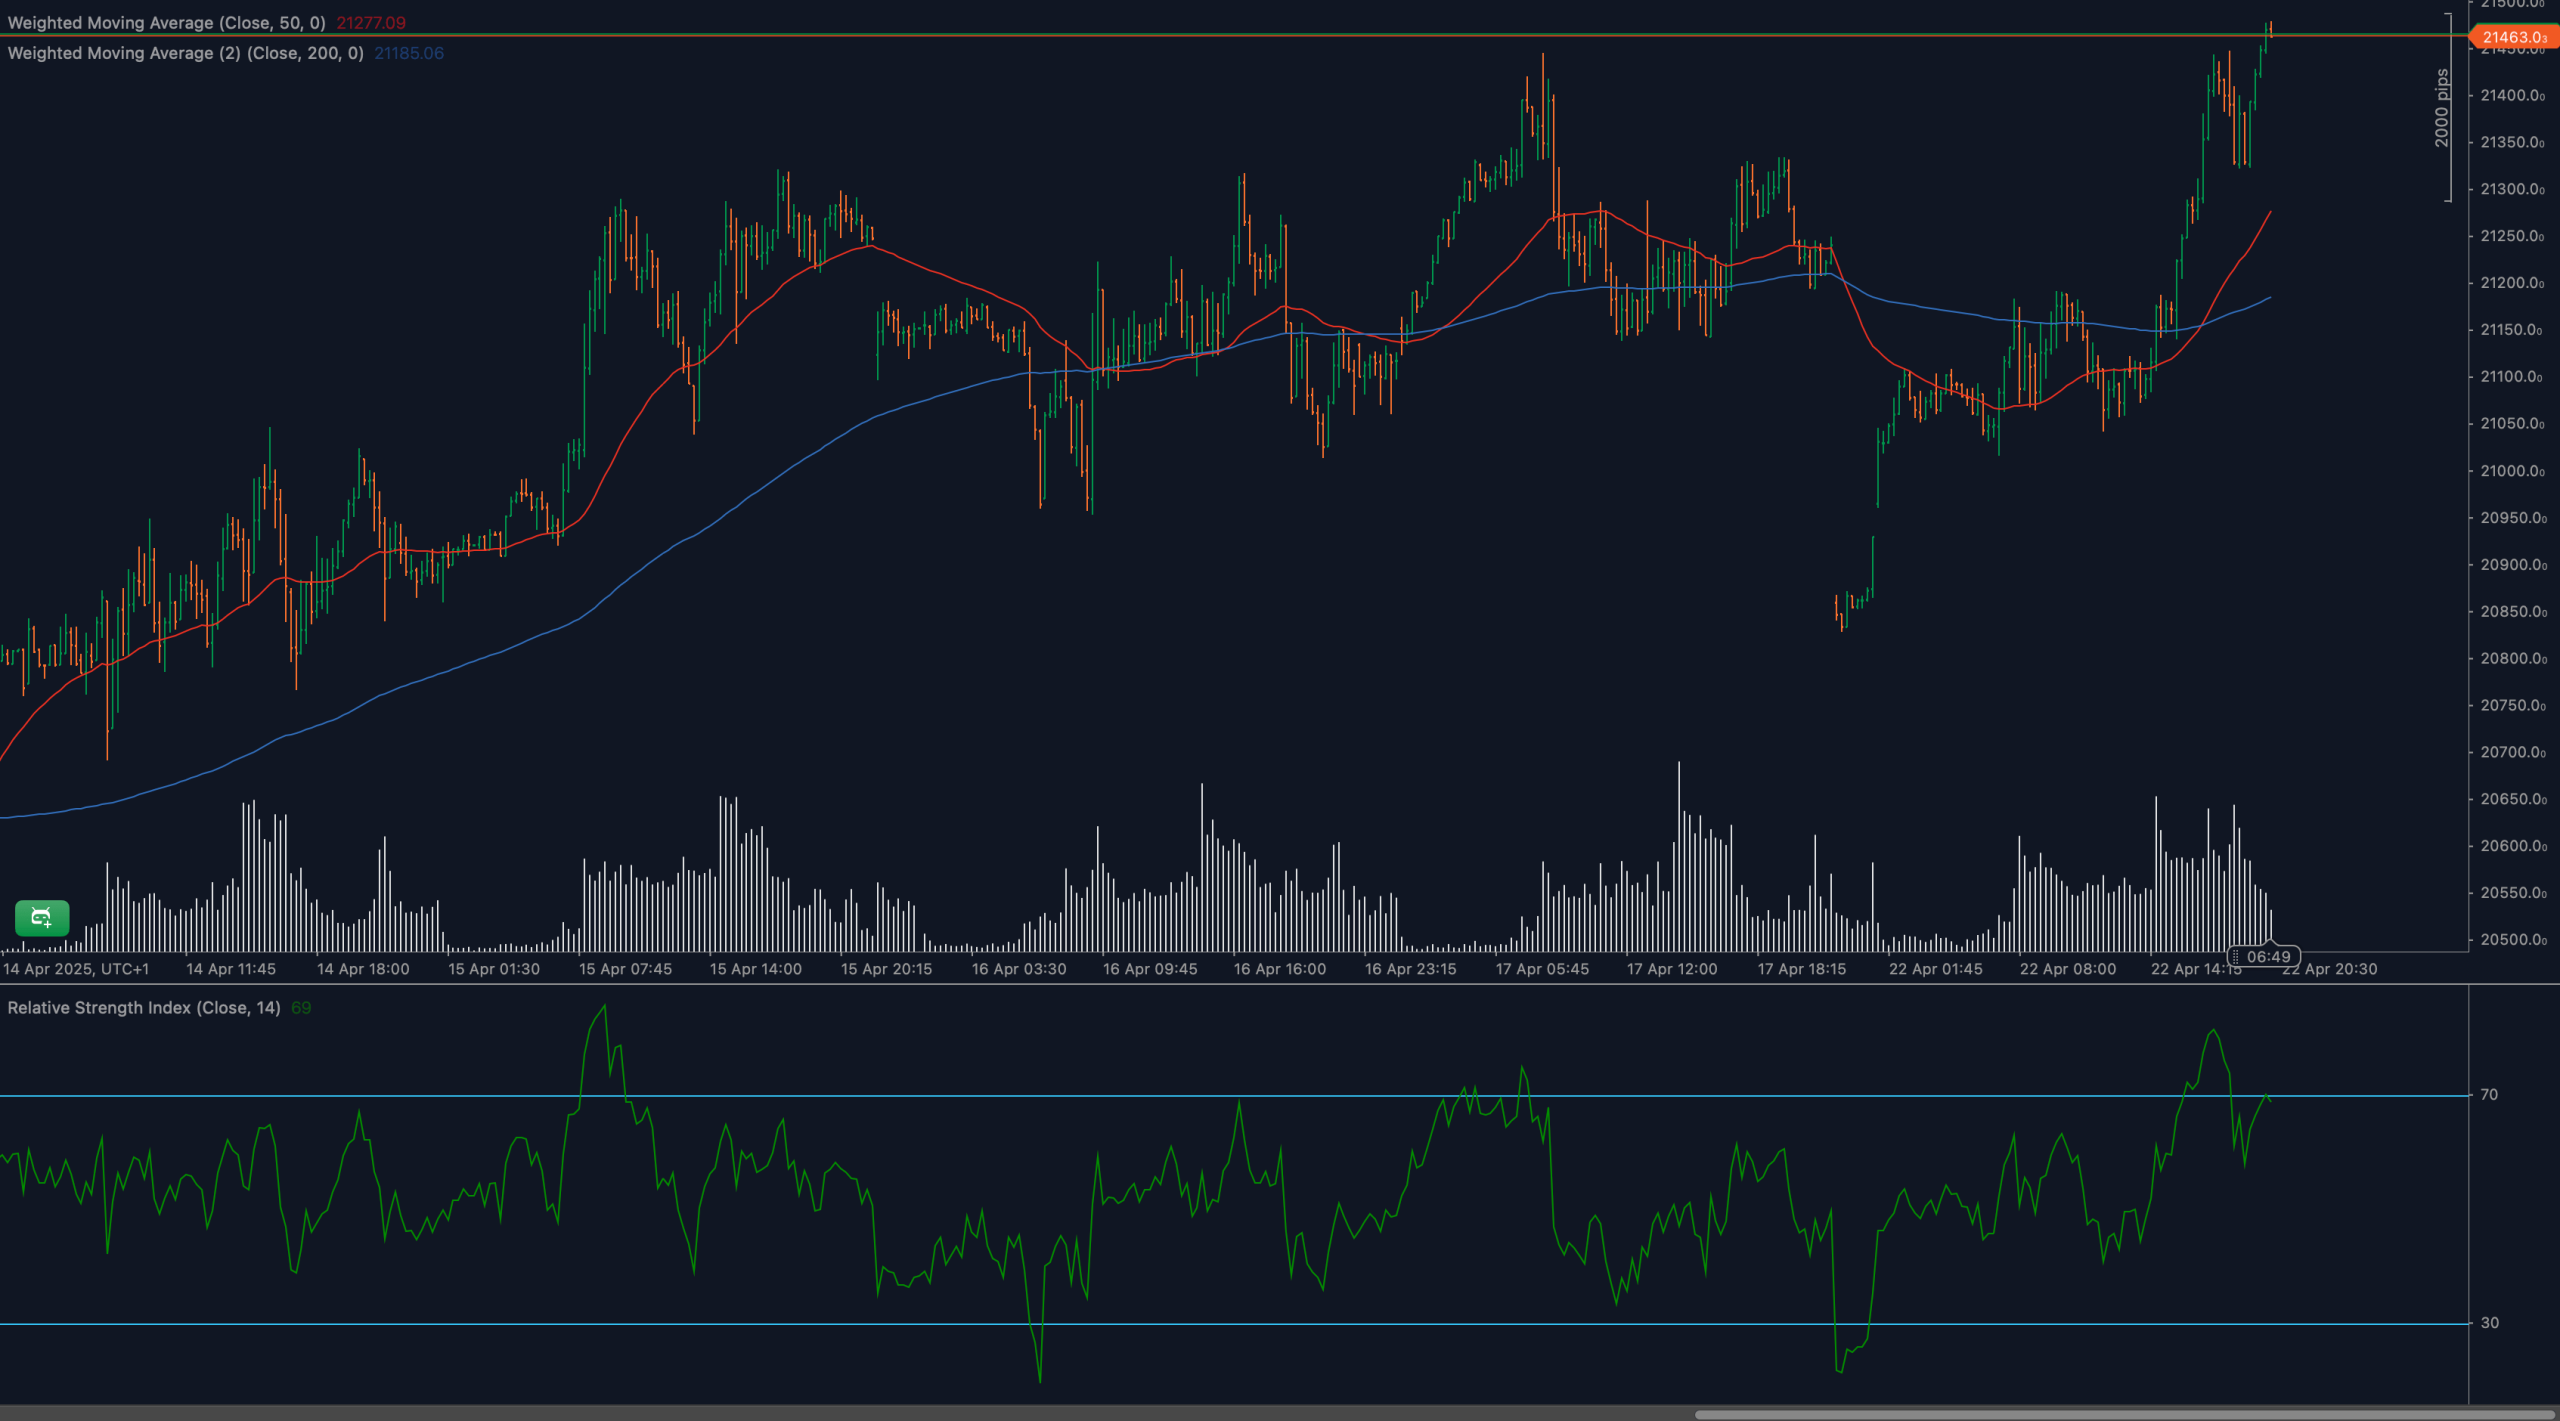
The DAX40 index has extended its bullish rally to test the critical 21,463 resistance zone. This level marks the highest point on the current leg of the uptrend and serves as a decisive pivot. While momentum remains clearly bullish, the pace of the move is starting to slow, and RSI is now hovering just below the overbought threshold.
Volume surged during the initial breakout but has since begun to taper, suggesting caution among buyers as price approaches key resistance. Unless a strong breakout follows, DAX40 may be vulnerable to a short-term correction or sideways consolidation.
📈 TECHNICAL ANALYSIS
What Are the Key Support and Resistance Levels for DAX40?
Resistance is now clearly defined at 21,463, the recent session high. If bulls can force a breakout, upside targets extend to 21,600 and 21,750. Initial support lies at 21,250, with stronger backing from previous structure near 21,000. A break below these levels could open downside toward 20,800.
Moving Average Analysis and Dynamic Price Levels
The index remains well above both the 50-period WMA (21,277) and the 200-period WMA (21,185), both of which are sloping upward. This alignment supports the current trend, and the 50-WMA could act as dynamic support if price pulls back. As long as DAX40 holds above these averages, the trend remains structurally bullish.
RSI Momentum Analysis and Divergence Patterns
The 14-period RSI is currently at 68, just below overbought territory. This level has historically triggered consolidations or shallow pullbacks in recent sessions. While no divergence is present yet, further upside with a flatlining RSI would be an early warning sign of momentum exhaustion. A break above 70 would confirm trend strength, while a move back under 60 could signal a shift.
Price Action and Candlestick Analysis
Recent candles show strong upward bodies with minimal wicks, confirming directional momentum. However, the last few candles near 21,463 show reduced range and indecision — often a precursor to consolidation. A breakout candle above resistance or a bearish engulfing would be the next major directional clue.
Chart Patterns and Formation Analysis
DAX40 appears to be forming a rising channel breakout extension, with the current move above 21,250 confirming bullish intent. If price fails at 21,463, the setup may evolve into a double-top or rounded resistance pattern. Until then, higher highs continue to favor the bulls.
Fibonacci Retracement Levels and Extension Targets
Using the leg from 20,520 to 21,463, a potential retracement could bring price back to 21,250 (23.6%), 21,150 (38.2%), or 21,000 (61.8%). If DAX40 breaks higher, Fibonacci extensions project 21,600 and 21,750 as next technical targets.
🔍 MARKET OUTLOOK & TRADING SCENARIOS
Bullish Scenario for DAX40
If DAX40 breaks and closes above 21,463, momentum continuation could lift the index toward 21,600 and 21,750. RSI would need to stay above 65 and volume must increase to confirm conviction. Watch for bullish follow-through candles above resistance.
Neutral Scenario for DAX40
If price consolidates below 21,463 and RSI stabilizes near 60–70, a sideways phase may develop. This would favor range-bound setups between 21,250 and 21,463. Traders should watch for coiling candles and volume compression.
Bearish Scenario for DAX40
A rejection at 21,463 and drop below 21,250 would introduce downside risks. RSI slipping below 55 and price returning toward the 50-WMA would strengthen bearish pressure. In that case, targets include 21,000 and 20,800.
💼 TRADING CONSIDERATIONS
Bullish entries may be taken above 21,463 on confirmed breakout with volume. Initial targets include 21,600 and 21,750, with stops beneath 21,300. For pullback traders, entries near the 50-WMA could offer attractive setups if RSI holds above 50.
Bearish setups may emerge on failed breakout attempts. Rejections near resistance with bearish divergence or candle patterns can justify shorts toward 21,250, 21,000, or 20,800. Stops should be placed above 21,500 to limit exposure.
🏁 CONCLUSION
DAX40 has reached a critical resistance level at 21,463 after a strong bullish breakout. The uptrend remains intact, but RSI near overbought and declining volume call for caution. Traders should look for confirmation — either a clear breakout continuation or signs of a reversal — before committing to directional trades.
⚠️ DISCLAIMER
This analysis is for educational purposes only and does not constitute financial advice. Trading involves significant risk, and you should consult a licensed financial advisor before making trading decisions.


