
📊 MARKET OVERVIEW
The DAX40 index is currently facing significant resistance at the critical 20,850 level, a region previously tested multiple times without a sustained breakthrough. This resistance has become a decisive factor for determining the short-to-medium-term direction of the index. The mixed signals from moving averages combined with neutral RSI momentum present traders with a complex and potentially volatile trading scenario.
Given the current technical alignment, it is essential to examine key technical indicators thoroughly, including support and resistance zones, moving average interactions, RSI patterns, candlestick formations, chart patterns, and Fibonacci retracement levels, to better anticipate the DAX40’s potential moves.
📈 TECHNICAL ANALYSIS
What Are the Key Support and Resistance Levels for DAX40?
The immediate resistance remains solid at 20,850. A confirmed breakout above this critical barrier could open pathways toward further upward targets around 21,000 and potentially extend higher towards 21,200. On the downside, immediate support is found around 20,600, closely followed by stronger support at the significant psychological level of 20,400. Deeper support levels come into play near 20,200 and 20,000.
Moving Average Analysis and Dynamic Price Levels
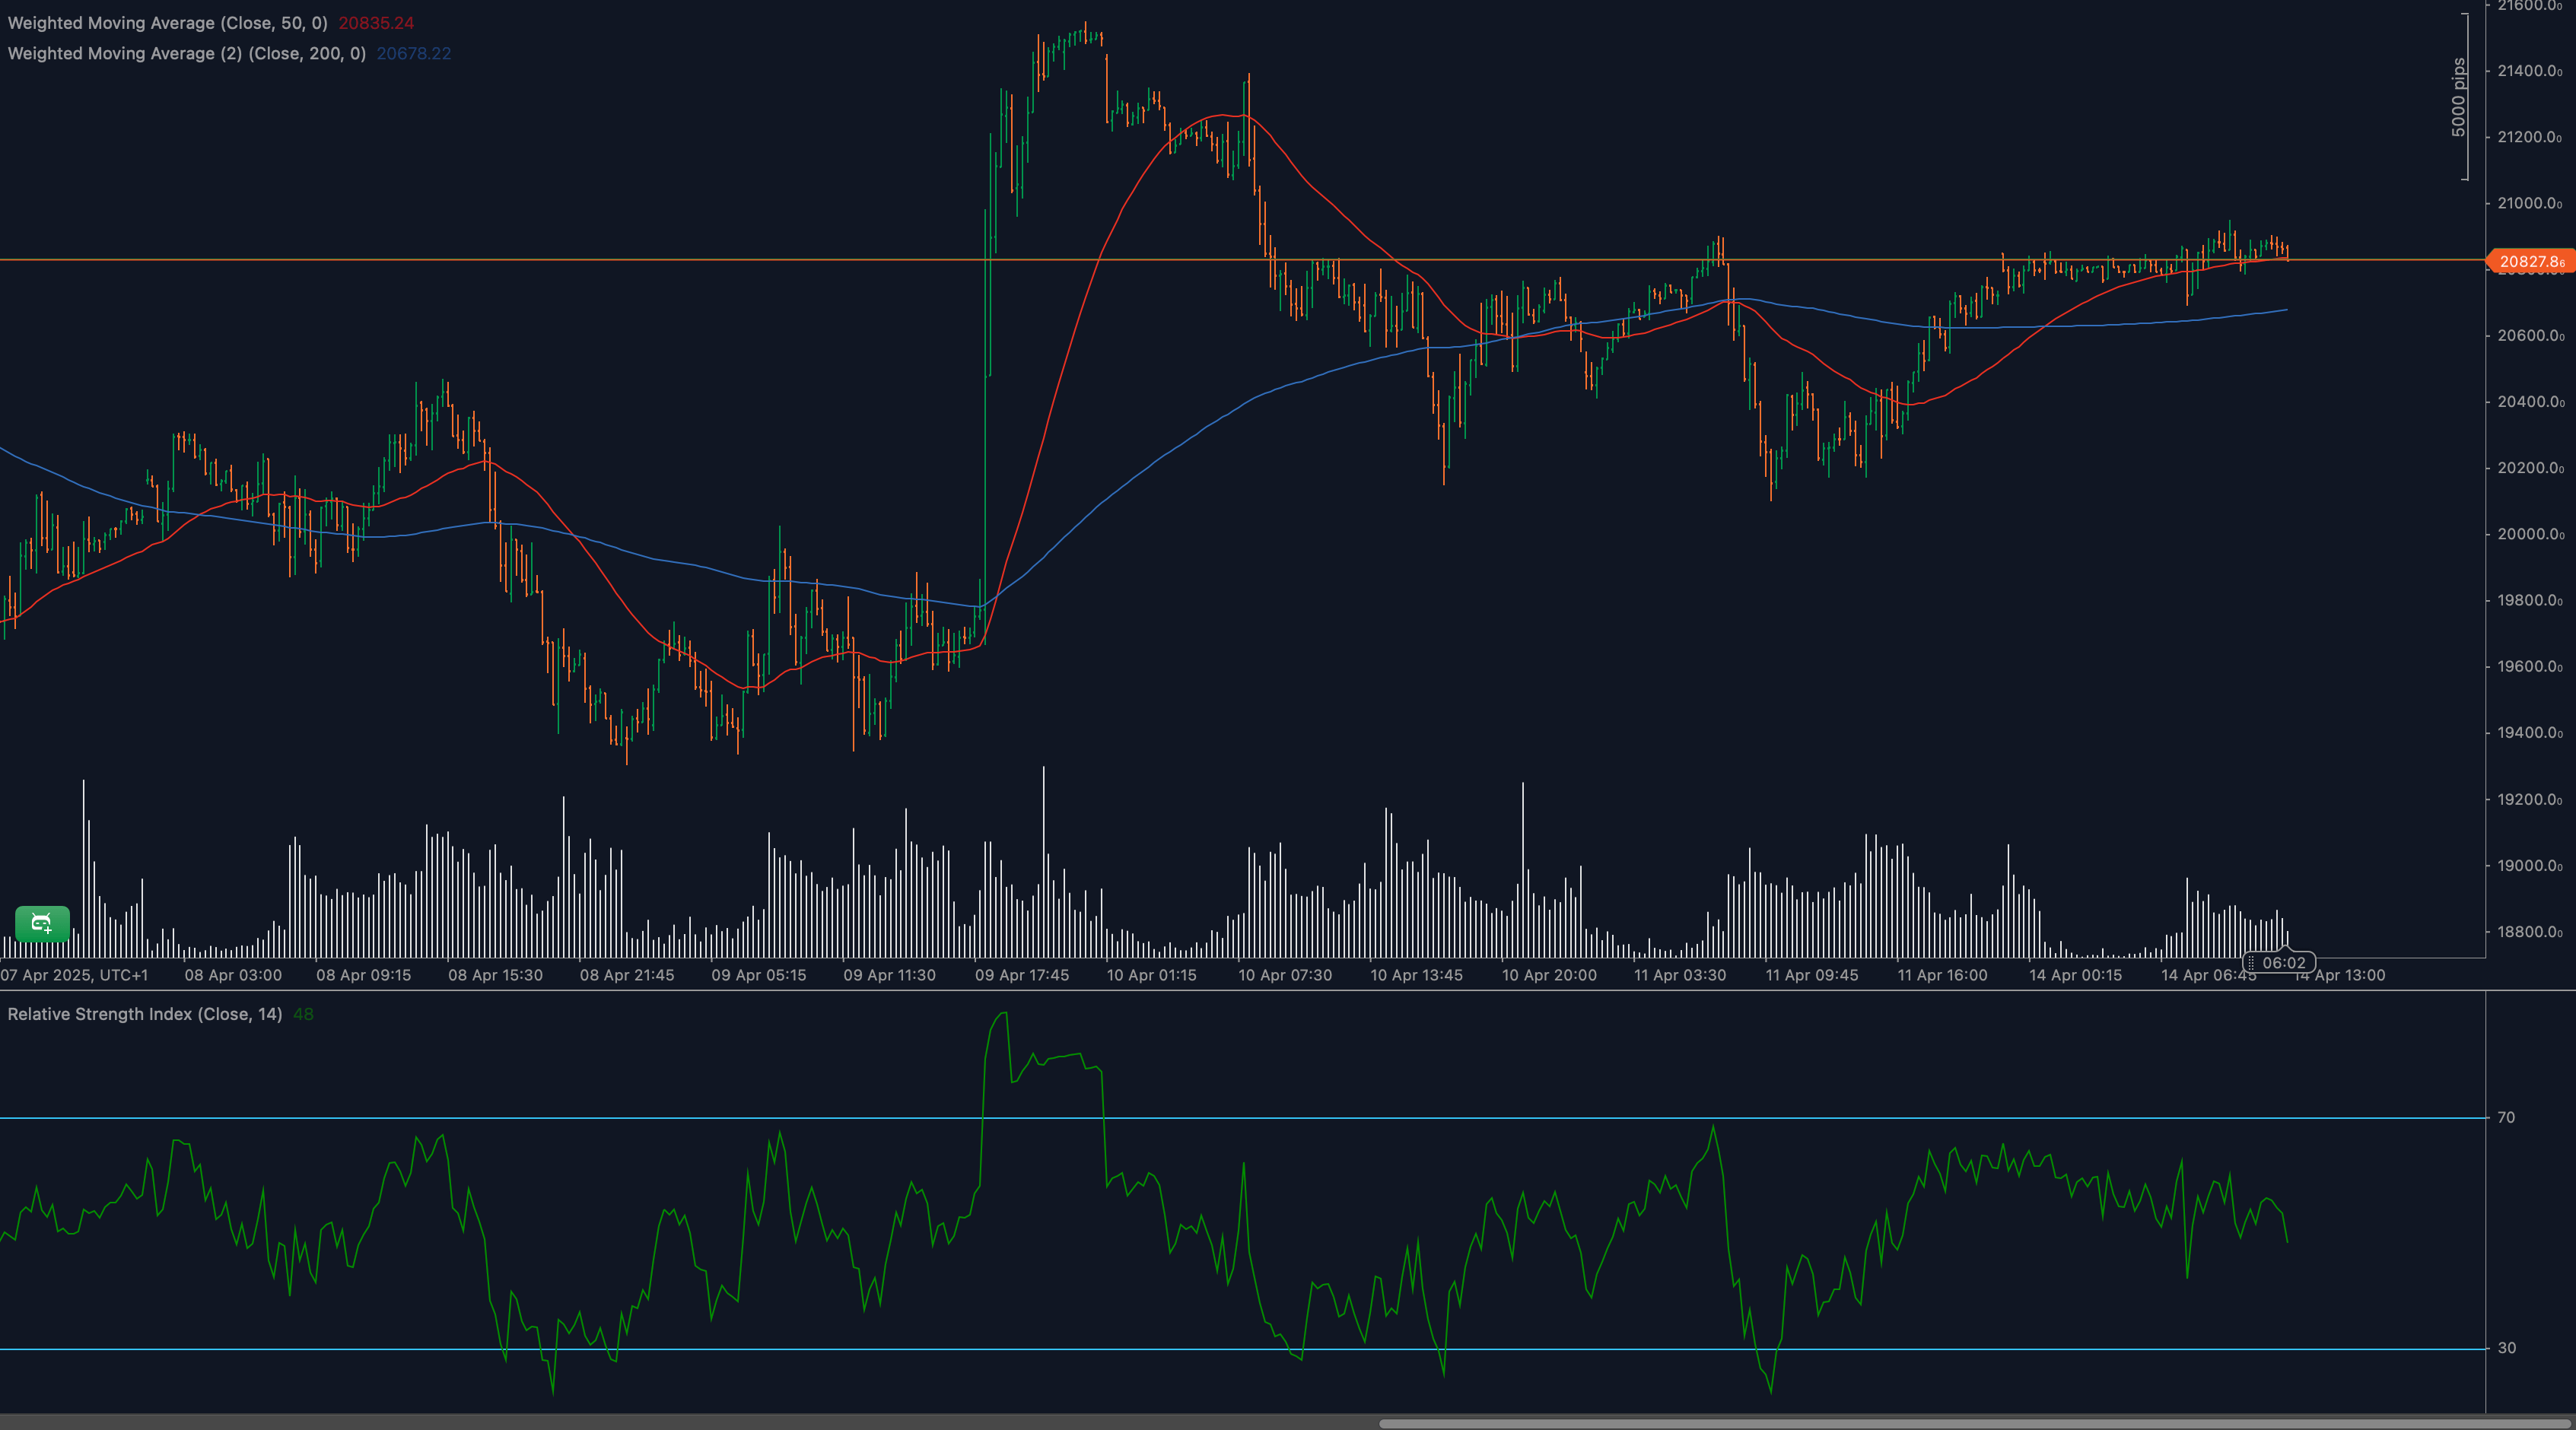
The DAX40 trades in close proximity to both the 50-period and 200-period weighted moving averages (WMAs), indicating mixed market sentiment. The 50-WMA near 20,835 is currently offering dynamic short-term support, while the 200-WMA around 20,675 provides a critical reference point for medium-term trends. Traders should remain vigilant for price interactions with these averages, as crossovers could signal important shifts in trend direction.
RSI Momentum Analysis and Divergence Patterns
Currently, the 14-period RSI hovers near the neutral level at around 48, reflecting indecision and balanced market forces. The neutral stance of RSI indicates neither bullish nor bearish dominance at present. Traders should remain alert for potential divergences between RSI and price movements, particularly around critical levels like 20,850, as these could provide early indications of forthcoming directional shifts.
Price Action and Candlestick Analysis
Recent candlestick activity near resistance at 20,850 reveals indecision, with predominantly small-bodied candles and frequent wicks demonstrating ongoing market uncertainty. This highlights the ongoing struggle between buyers and sellers at this crucial technical juncture. Traders should closely monitor candlestick developments for definitive breakout or reversal signals, such as clear bullish engulfing or bearish rejection patterns.
Chart Patterns and Formation Analysis
Currently, the DAX40 index is exhibiting signs of a horizontal consolidation pattern around resistance at 20,850, with stable support developing near the 20,600-20,700 area. Such sideways trading suggests indecision but typically precedes significant breakouts. A bullish breakout would favor the resumption of a recent upward trend, whereas a bearish break below key supports would signal a corrective phase.
Fibonacci Retracement Levels and Extension Targets
Applying Fibonacci retracement from recent significant swings, immediate support emerges near the 38.2% retracement at approximately 20,600, followed by the 50% retracement around 20,400 and the deeper 61.8% retracement near 20,200. For bullish scenarios, Fibonacci extension levels indicate potential upside targets at 21,000 (127.2%) and further at 21,200 (161.8%), contingent upon breaking through resistance at 20,850.
🔍 MARKET OUTLOOK & TRADING SCENARIOS
Bullish Scenario for DAX40
A decisive break above the resistance at 20,850 would validate a bullish continuation scenario, targeting subsequent resistance levels around 21,000 and potentially 21,200. Traders could capitalize on this breakout by looking for supportive RSI momentum and clear bullish candlestick confirmation.
Neutral Scenario for DAX40
If DAX40 continues trading sideways around the current resistance without clear directional commitment, short-term neutral trading strategies could become viable. Range-bound opportunities may be considered, with careful attention to tight stops and clear risk management around the identified support and resistance boundaries.
Bearish Scenario for DAX40
Should DAX40 face strong rejection at 20,850 and subsequently break the immediate support around 20,600, bearish pressure might increase significantly. This could drive the index towards deeper support targets around 20,400 and possibly 20,200, guided by weakening RSI momentum and bearish candlestick patterns.
💼 TRADING CONSIDERATIONS
Effective trading around the 20,850 resistance requires heightened vigilance for breakout confirmations or reversal indicators. Traders should employ prudent risk management through strategic stop-loss placement near key technical levels. Utilizing partial position exits at identified Fibonacci and historical support/resistance areas will help manage potential volatility and enhance profitability.
🏁 CONCLUSION
The DAX40 is currently battling resistance at 20,850, with mixed moving average signals and neutral RSI momentum presenting a complex scenario for traders. Clear breakout or rejection signals around this pivotal level will be essential for guiding the index’s next directional moves. Strategic trade execution and disciplined risk management will be crucial for navigating the current market conditions effectively.
⚠️ DISCLAIMER
This analysis is informational and does not represent financial advice. Trading involves significant risk, and traders should seek professional advice before entering market positions.


