
📊 MARKET OVERVIEW
DAX40 is staging an assertive comeback after consolidating in late April, now retesting the recent high at 23,160. This level previously marked a key exhaustion point, but the current price action reflects renewed bullish strength, supported by a favorable structure and surging RSI.
The recovery was swift and disciplined, forming a V-shaped rebound off the 78.6% Fibonacci zone near 22,450. Now, bulls are attempting a decisive breakout above the 0% extension of the previous swing. With the backdrop of improving European macro sentiment and risk-on equity flows, the index may be on the verge of entering price discovery if it closes convincingly above the peak.
📈 TECHNICAL ANALYSIS
Key Support and Resistance Levels
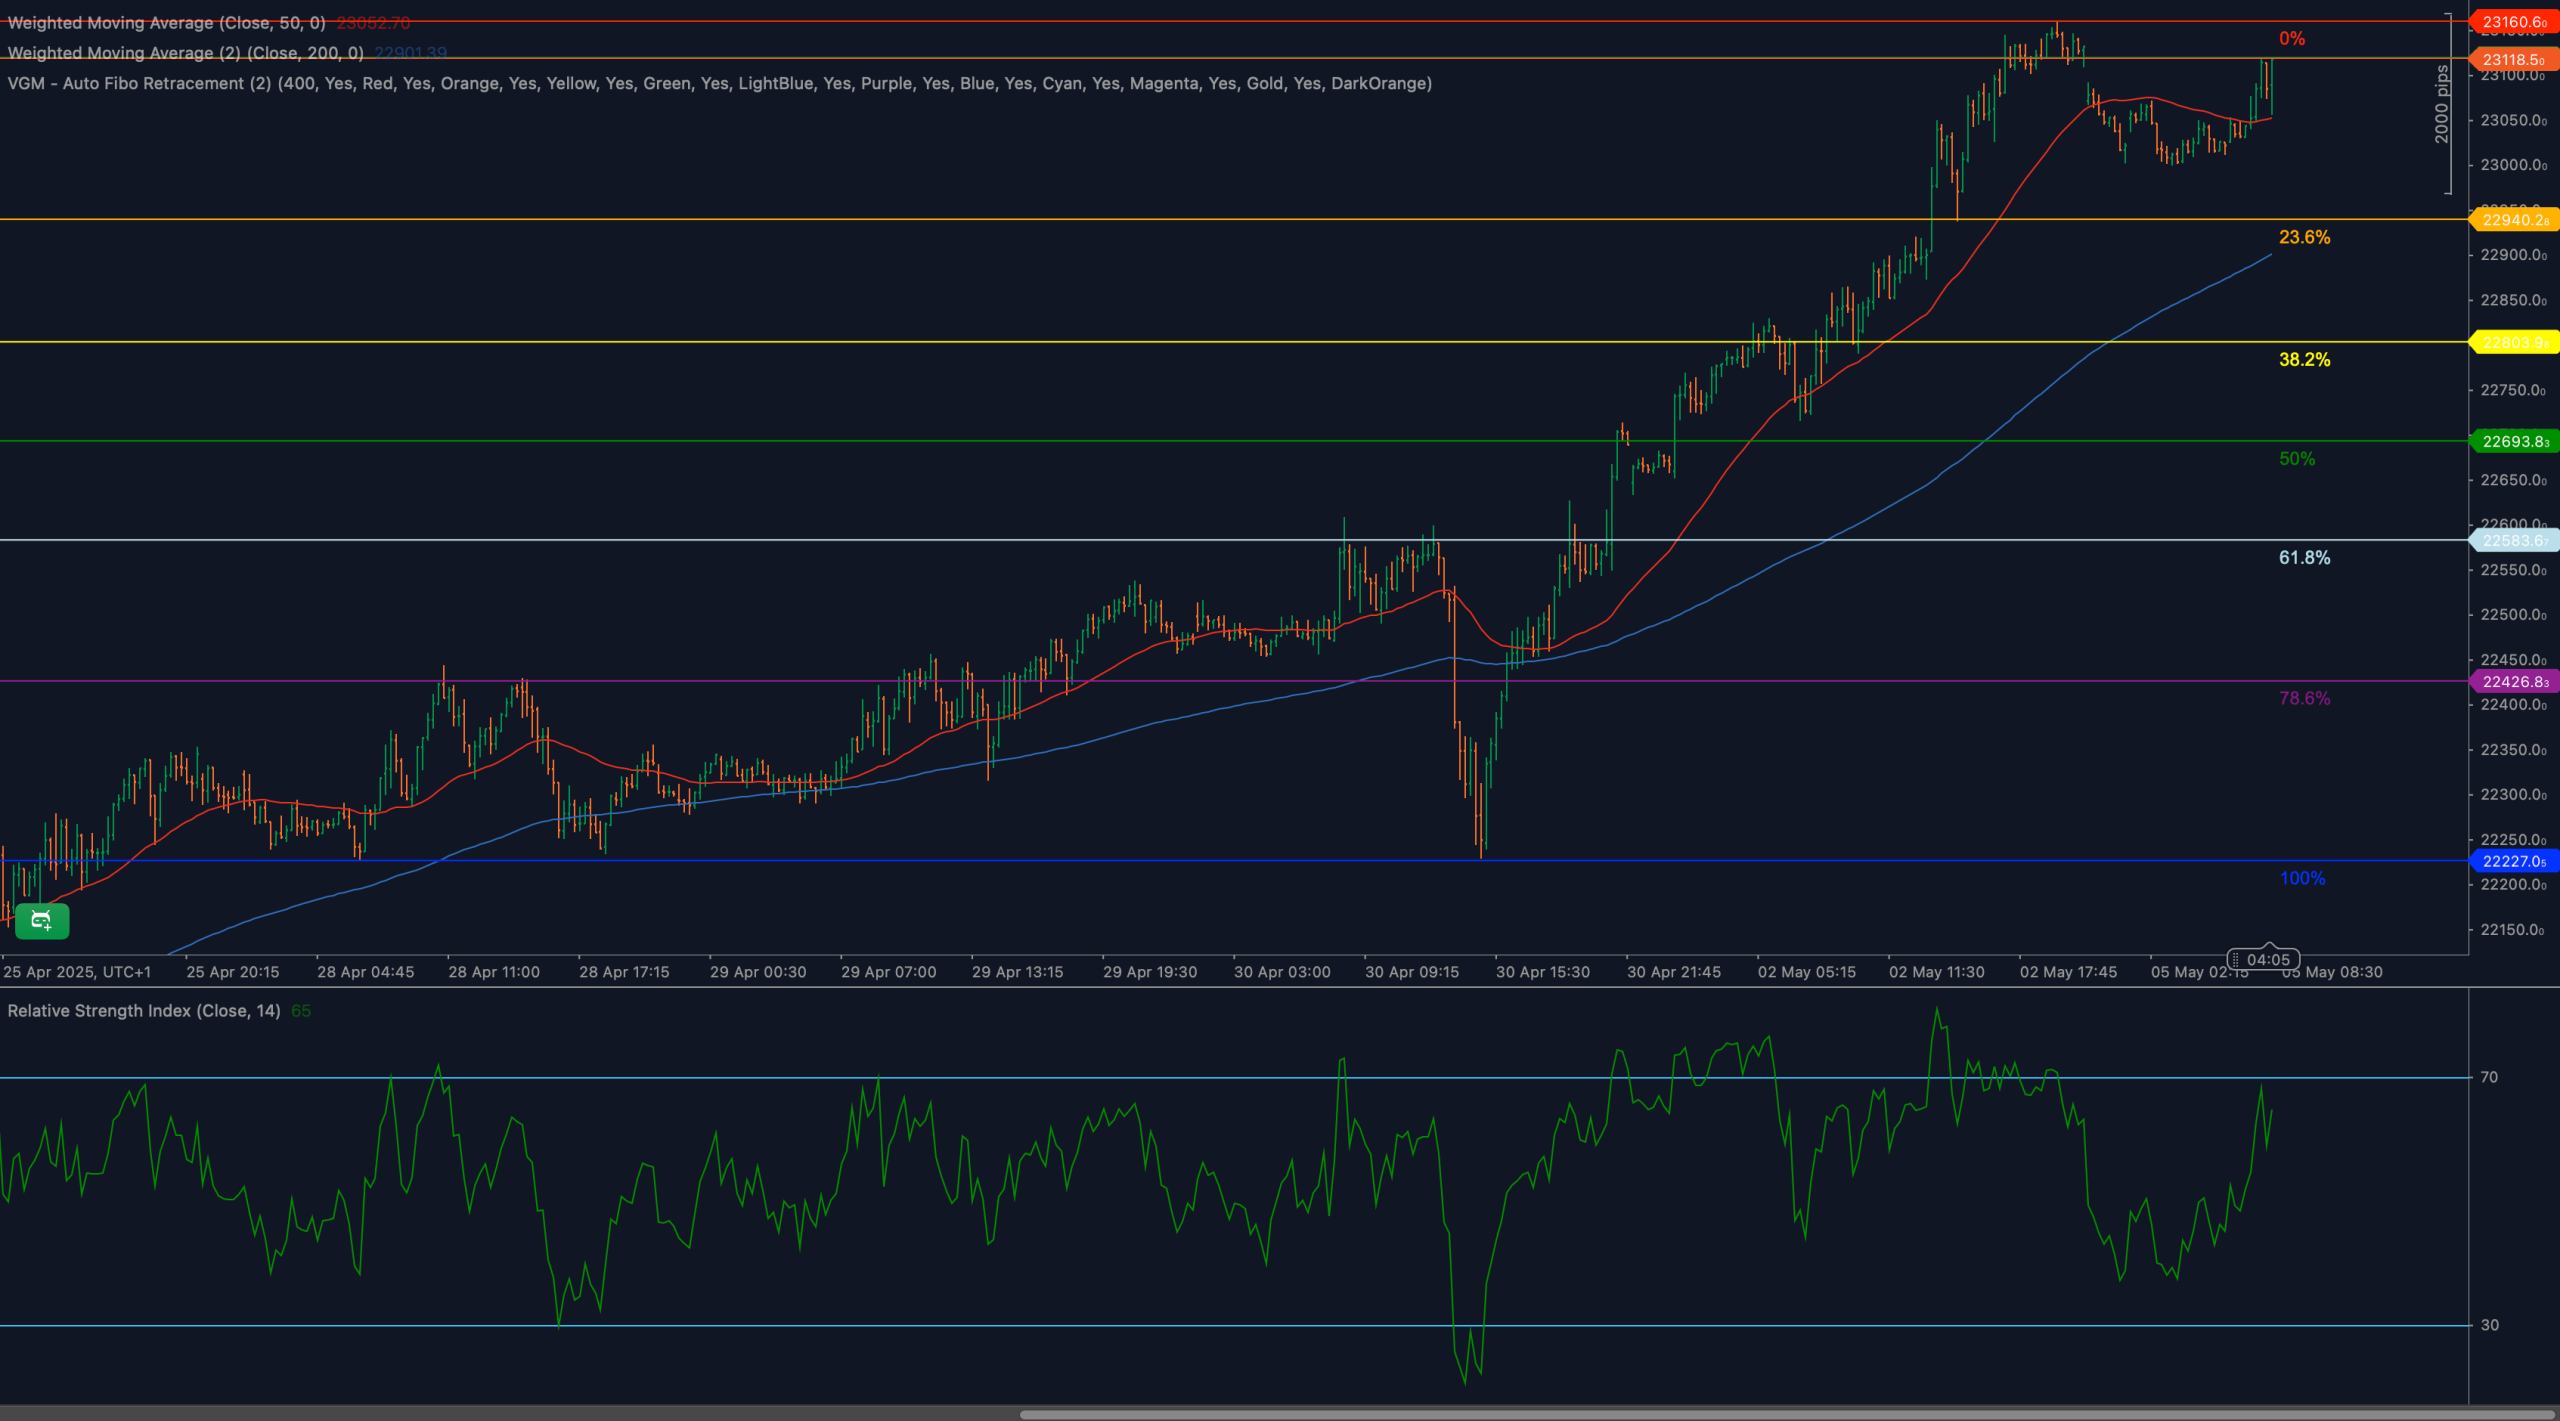
Immediate resistance lies at 23,160 — the all-time high and current psychological barrier. A clean break opens the door toward the 23,290 Fibonacci extension. If rejected here, interim support can be found at 23,030, followed by the deeper zone at 22,693 (50% retracement). Below this, the key structure lies at 22,368 and 22,207, where the original impulse leg began.
Moving Averages and Dynamic Price Action
Price is trending well above both the 50-period and 200-period Weighted Moving Averages, which are aligned bullishly. The 50-WMA has turned upward again after a brief flattening period, while the 200-WMA continues to slope positively.
This dynamic suggests that momentum is rebuilding, and if price remains supported above 22,693–22,900, bulls retain technical dominance. A failure to hold 22,693 would flip short-term structure to neutral.
RSI Momentum and Bullish Pressure
The Relative Strength Index (14) is climbing toward the 70 threshold, currently hovering near 65. This marks the strongest bullish momentum since mid-April. If RSI pushes through 70 on a breakout above 23,160, it would confirm renewed buying pressure.
A bearish divergence is not yet evident, but traders should watch for any slowing momentum as price nears overbought territory.
Candlestick Behavior and Price Action Clarity
Recent candles reveal strong bullish conviction — large-bodied bullish candles are followed by narrow consolidation, suggesting controlled accumulation rather than volatility spikes. The wickless nature of recent highs also implies cleaner breakout potential.
If a strong bullish candle closes above 23,160 with follow-through volume, the breakout would be technically valid. A failed attempt and bearish engulfing pattern near the high would argue for rejection.
Chart Structure and Breakout Formation
The current formation resembles a rounded base or cup structure from the April low near 22,207. The breakout zone at 23,160 represents the rim of this pattern. If price breaches this rim, a classic cup-and-handle breakout structuremay unfold.
Alternatively, if price stalls near 23,160 and pulls back modestly to 23,000–22,900, it could form a healthy handle before launching higher.
Fibonacci Retracement and Extension Levels
The Fibonacci retracement and extension framework continues to play a pivotal role in mapping out strategic zones on the DAX40 chart. Measured from the April swing low near 22,207 to the recent peak at 23,160, several key levels emerge as structurally significant.
The 23.6% Fibonacci extension, located near 23,290, marks the first bullish continuation target. If price breaks above the all-time high at 23,160, this level may serve as an initial magnet for short-term buyers. A clear and confident push into this region would likely draw in trend-followers and breakout traders, further fueling upside momentum.
The 38.2% retracement, sitting around 23,030, represents the shallowest corrective level and often acts as the first zone where profit-taking may emerge in a rising market. If price dips from current levels but finds support here, it would signal underlying strength and suggest that bulls are still in control.
At the 50% retracement level, located at 22,693, a more balanced battle between buyers and sellers could take shape. This midpoint often acts as a psychological pivot — not just for technical traders, but also for institutional flows gauging whether to re-enter or reduce exposure. Holding above this level maintains the medium-term bullish structure.
Deeper into the structure lies the 61.8% retracement, commonly known as the “golden ratio,” positioned at 22,368. A retracement to this level — while still technically valid within a bullish trend — would raise questions about short-term exhaustion. This zone would likely serve as a key battleground between long-term bulls and short-term profit-takers.
The 78.6% retracement, near 22,450, acts as a deeper correction threshold. If price falls this far, it would suggest the recent rally is losing traction, and any recovery would need a strong catalyst. Still, this level may attract bargain hunters and serve as a last line of support before invalidating the bullish thesis.
Finally, the 100% retracement base at 22,207 marks the origin of the current impulse leg. A move all the way back here would constitute a full retracement, signaling a failure of the breakout structure and a possible trend reversal. Such a decline would reframe the entire price action as a false breakout rather than a bullish continuation.
Collectively, these Fibonacci levels not only offer precise price targets for continuation or retracement but also serve as sentiment checkpoints that reveal the market’s appetite for risk at various depths of correction. As long as DAX40 remains above the 50%–61.8% zone, the broader uptrend remains intact — but any violation of the lower levels would shift the technical bias toward caution.
🔍 MARKET OUTLOOK & TRADING SCENARIOS
Bullish Scenario
If DAX40 breaks above 23,160 with conviction, traders may target 23,290 and potentially 23,450 (next projected resistance). RSI must sustain above 65 with strong follow-through. A clean breakout followed by consolidation would validate bullish continuation.
Neutral Scenario
If the index remains capped at 23,160 and ranges between 23,030–23,160, a sideways consolidation phase may unfold. This could form a bull flag or handle before a renewed breakout attempt. RSI would likely flatten around 60–65.
Bearish Scenario
A sharp rejection at 23,160 with follow-through downside breaking below 22,693 would weaken the current bullish structure. Bears would then aim for 22,450 and eventually 22,207 as key downside levels. RSI below 50 would confirm momentum loss.
💼 TRADING CONSIDERATIONS
- Bullish setup: Buy breakout above 23,160 with targets at 23,290 and 23,450. Stops below 23,000.
- Bearish setup: Short on rejection and close below 22,693, targeting 22,450 and 22,207. Stops above 23,160.
- Maintain tight risk management near highs as volatility may expand around key levels.
🏁 CONCLUSION
DAX40 is once again on the verge of a potential breakout, retesting the 23,160 ceiling. Momentum has rebuilt, structure remains bullish, and RSI favors buyers. A confirmed breakout may unlock fresh all-time highs, but failure here risks a pullback into the Fibonacci retracement zones. Traders should stay vigilant and react to price confirmation around this decisive zone.
⚠️ DISCLAIMER
This analysis is for informational purposes only and does not constitute investment advice. Always consult with a licensed financial advisor before making trading decisions.


