
📊 MARKET OVERVIEW
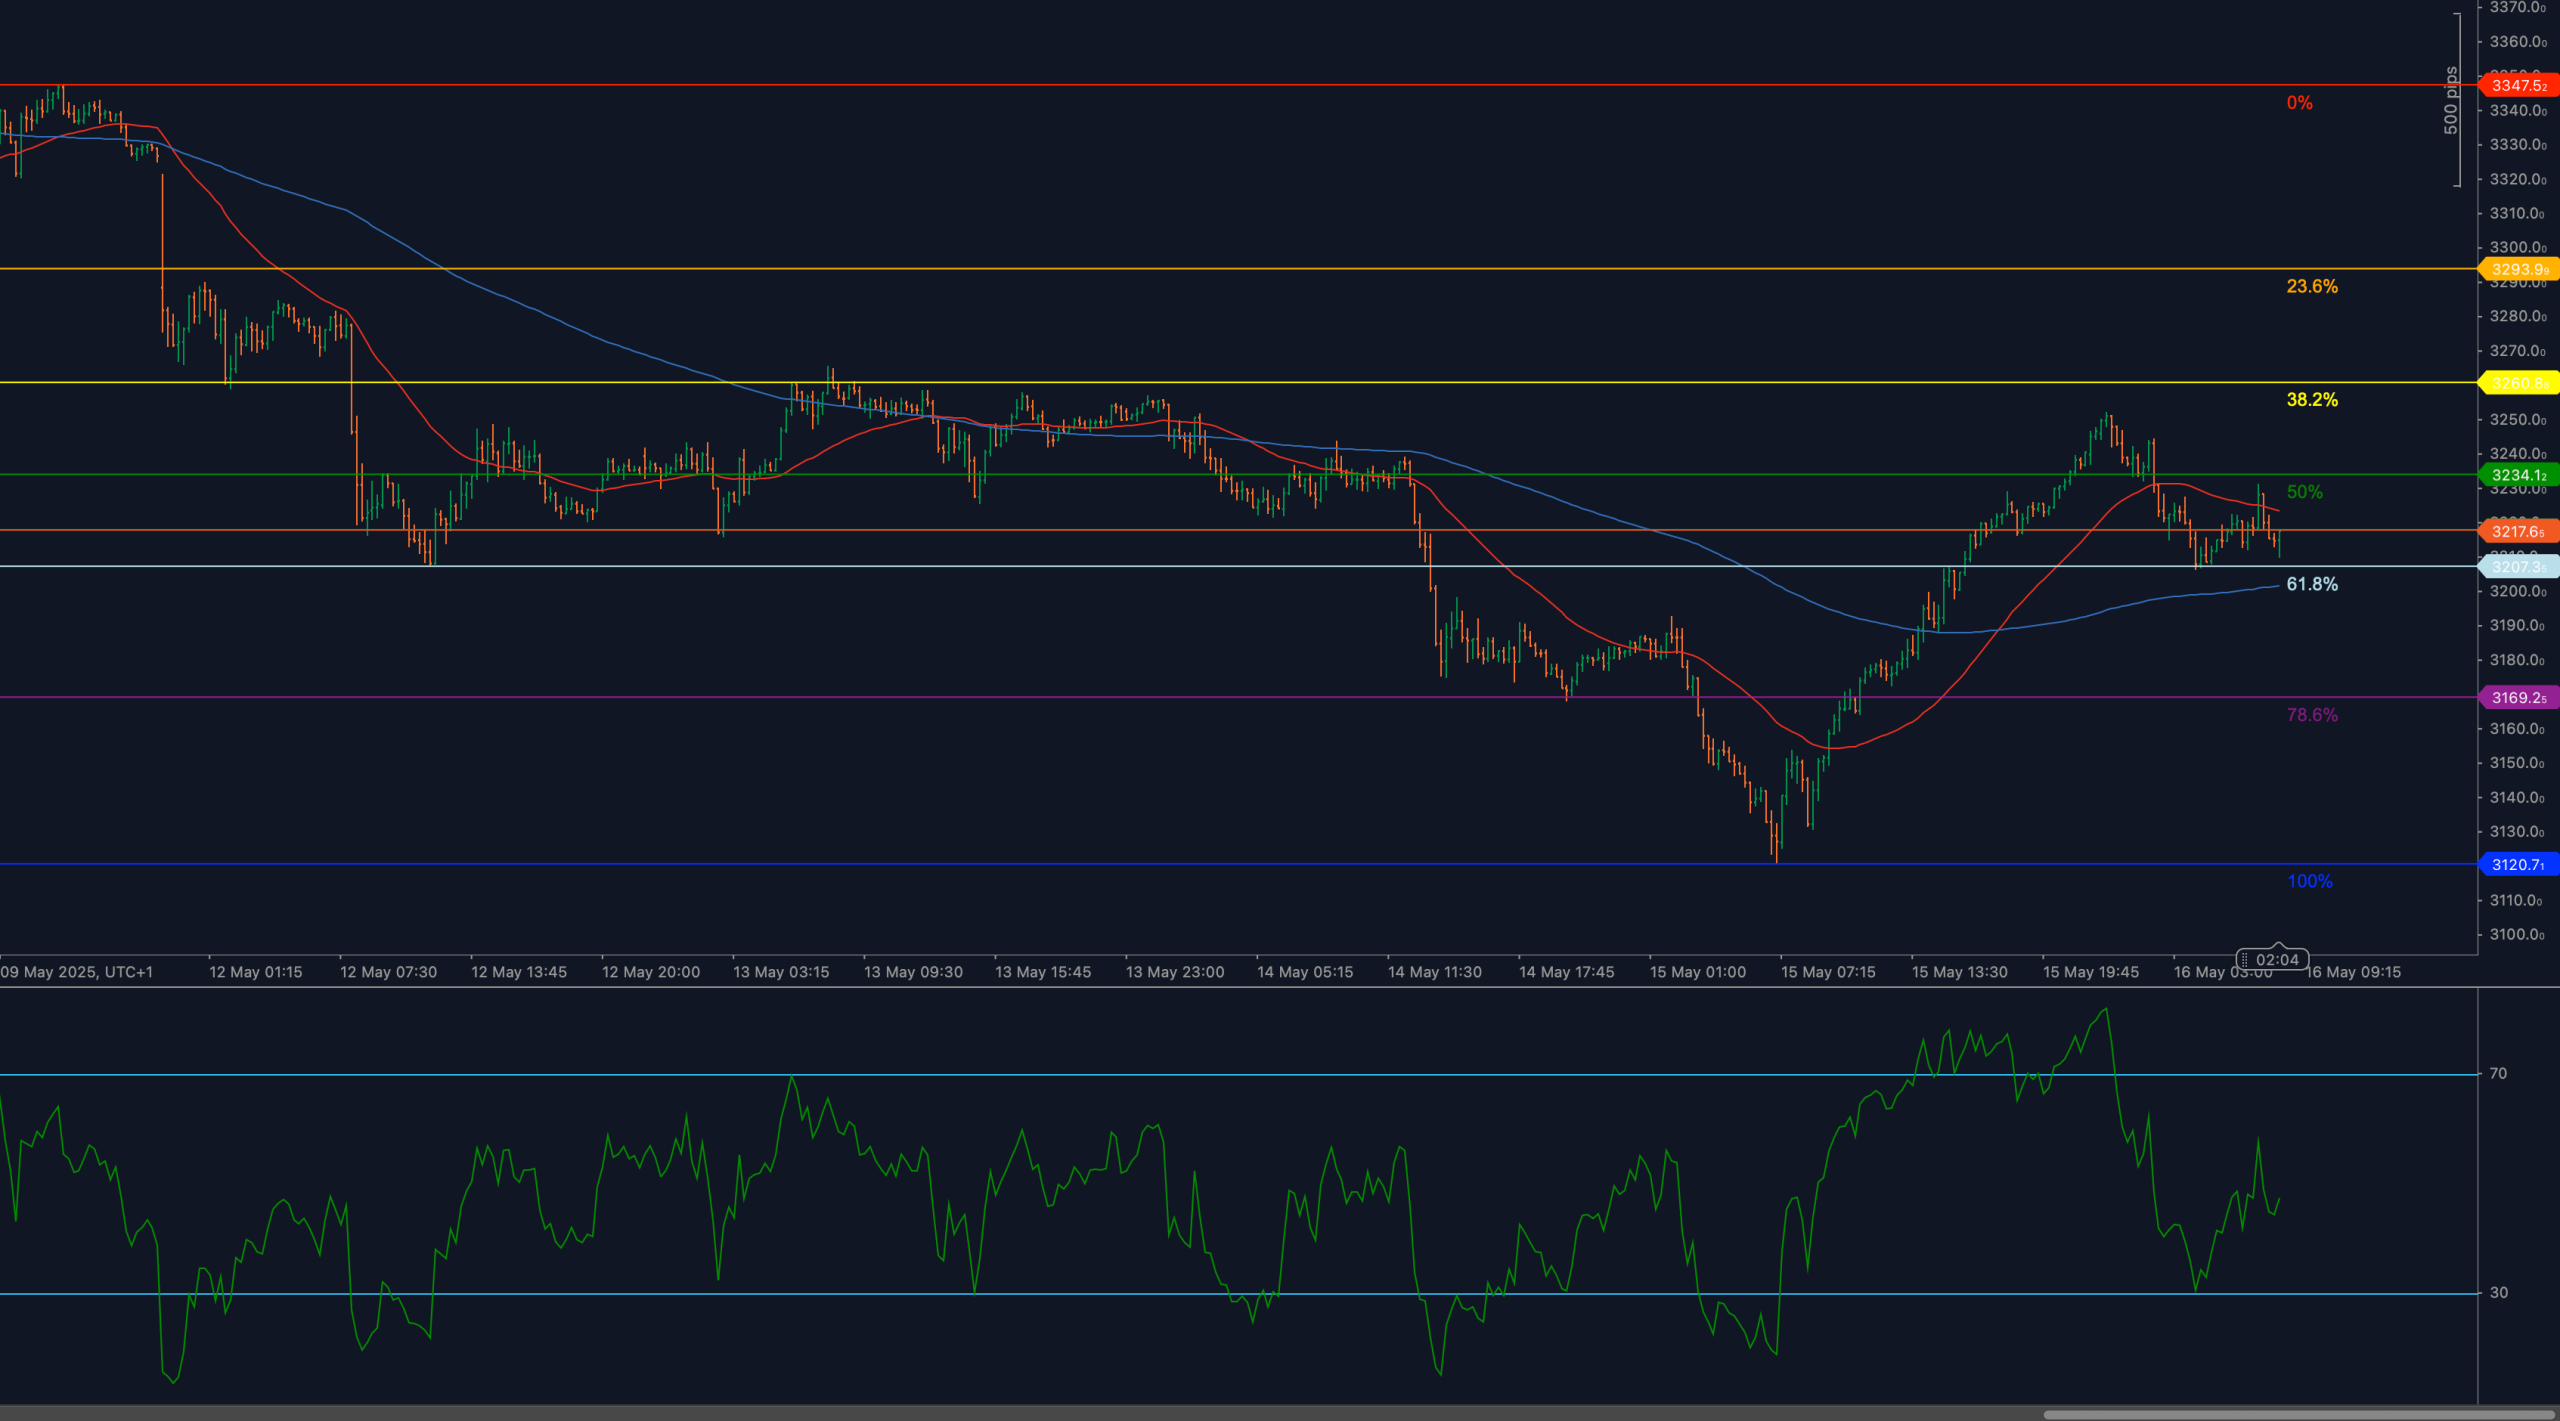
Gold (XAU/USD) has staged a rebound from last week’s 3,120 swing low, rallying back toward the 3,247 level, where the recovery has run into resistance. This zone coincides with the 50% Fibonacci retracement drawn from the May 13 high at 3,347 down to the May 15 low. Despite the initial strength of the bounce, price action has turned indecisive as bulls struggle to break past layered resistance, while RSI retreats from overbought territory.
The move higher was fueled by weaker U.S. data and mild dollar softness, but with real yields still elevated and safe-haven demand not intensifying, gold is showing signs of tactical exhaustion. The metal remains vulnerable to downside retracement unless buyers can reclaim upper structure and momentum re-engages convincingly.
📈 TECHNICAL ANALYSIS
Key Support and Resistance Levels
The critical resistance sits at 3,247, marking the 50% Fibonacci retracement and an area that has historically acted as both support and resistance. Above that, the 3,274 level — corresponding with the 38.2% retracement — becomes the next upside test. A sustained breakout above 3,274 would re-open the path toward the former high at 3,347.
On the downside, immediate support is located at 3,217, which aligns closely with intraday structure and the mid-band of the rally. A break below this exposes the 3,207 level, defined by the 61.8% Fibonacci retracement and reinforced by the 200-period moving average. A deeper drop beneath 3,207 would target the 3,169–3,120 zone, where the rally began and structure would be at risk of full retracement.
Moving Averages and Dynamic Price Action
Price is hovering between the 50-period and 200-period weighted moving averages, with the 200-WMA near 3,207offering structural support and the 50-WMA slightly overhead near 3,247, reinforcing resistance. This alignment creates a compression zone that typically precedes a directional breakout or breakdown.
The slope of the 200-WMA is neutral to slightly bearish, while the 50-WMA remains flat — indicating that medium-term momentum is in flux and awaiting resolution. Bulls need to clear 3,247 and reclaim 3,274 to regain dominance.
RSI Momentum and Bullish Pressure
The 14-period RSI surged during the rebound, reaching into overbought territory near 72, but has since rolled over and is now stabilizing around 55. This behavior reflects a loss of bullish momentum and suggests that the rally may be overextended unless buyers return with volume and conviction.
A break below 50 would shift RSI into neutral-bearish territory and confirm that the current rally has failed structurally. A reclaim of the 60–65 zone would be needed to revalidate the upside case.
Candlestick Behavior and Price Action Clarity
Candlestick structure has turned indecisive. After a strong run-up from 3,120, recent candles show upper wicks and narrowing bodies around 3,247, signaling hesitation and possible supply pressure. No bullish engulfing or continuation candles have formed above resistance, and the presence of rejection wicks confirms market uncertainty.
If price begins closing below 3,217, especially on increasing bearish body size, it would suggest the rally is being rejected at key levels and further weakness is likely.
Chart Structure and Reversal Risk
The broader structure appears to be a bear market rally within a correctional leg, with the recovery from 3,120 looking more like a counter-trend rebound than a full bullish reversal. The inability to close above 3,247 reinforces that thesis, and the formation of a potential right shoulder near current levels raises the risk of a breakdown if 3,207 fails.
Should gold break lower, the retracement would target 3,169 (78.6%) and possibly retest the full leg at 3,120, which would constitute a failed rally and renew bearish momentum.
Fibonacci Retracement and Extension Levels
The Fibonacci structure drawn from 3,347 to 3,120 remains dominant. Price has reacted clearly at the 50% level (3,247) and is showing sensitivity to both the 38.2% (3,274) and 61.8% (3,207) zones. A break below 3,207 would target 3,169, and a full extension through 3,120 could project downside Fibonacci expansions toward 3,085–3,060, depending on macro conditions.
If 3,247 is broken to the upside, and 3,274 cleared, extension targets to 3,290–3,305 become viable, though confirmation via volume and RSI would be essential.
🔍 MARKET OUTLOOK & TRADING SCENARIOS
Bullish Scenario
A sustained move above 3,247, supported by RSI reclaiming 60+, would pave the way for a test of 3,274 and potentially 3,305. Buyers must defend 3,217 and step in above 3,247 to avoid a failed rally.
Neutral Scenario
Sideways price action between 3,217 and 3,247, with RSI oscillating in the 50–60 range, would reflect indecision. This zone may consolidate until new macro catalysts emerge.
Bearish Scenario
A clean breakdown below 3,217, followed by a loss of 3,207, would expose 3,169, then the full retracement at 3,120. RSI moving below 50 would confirm bearish re-entry.
💼 TRADING CONSIDERATIONS
Traders should watch for confirmation at 3,247. Bullish breakouts require RSI validation and volume. Fading rallies near resistance or breakdowns below 3,207 may offer bearish setups, targeting 3,169 and 3,120.
🏁 CONCLUSION
XAU/USD is pausing at a critical junction near 3,247, with the 50% Fibonacci retracement capping momentum and RSI rolling over from overbought territory. Price remains trapped between key moving averages, and the broader structure suggests vulnerability to renewed downside. A breakout above 3,274 would revive bullish momentum, but failure to hold above 3,217 risks a return toward the 3,120 lows.
⚠️ DISCLAIMER
This analysis is for informational purposes only and does not constitute financial advice. Always consult with a licensed financial professional before making trading decisions.


