
📊 MARKET OVERVIEW
USD/JPY has rebounded modestly after reaching a local low at 142.60, but the recovery effort remains fragile and capped by Fibonacci resistance. The pair attempted to regain upside traction early in the session, but momentum faded as sellers reappeared near the 61.8% retracement at 142.88. Despite initial stability, price has failed to reclaim critical resistance thresholds and remains beneath the major weighted moving averages on the hourly chart. The bearish structure remains largely intact following the post-ISM Services selloff, and the lack of volume during the rebound adds further concern for bulls.
From a macro perspective, softening U.S. yields and rising risk-off tones have continued to pressure the dollar against safe-haven currencies like the yen. While the Bank of Japan remains dovish, the lack of clear U.S. dollar strength coupled with weaker service sector data has led to a defensive tone in USD/JPY. Unless the pair can close decisively above the 143.00 region, the broader risk skews toward downside continuation.
📈 TECHNICAL ANALYSIS
Key Support and Resistance Levels
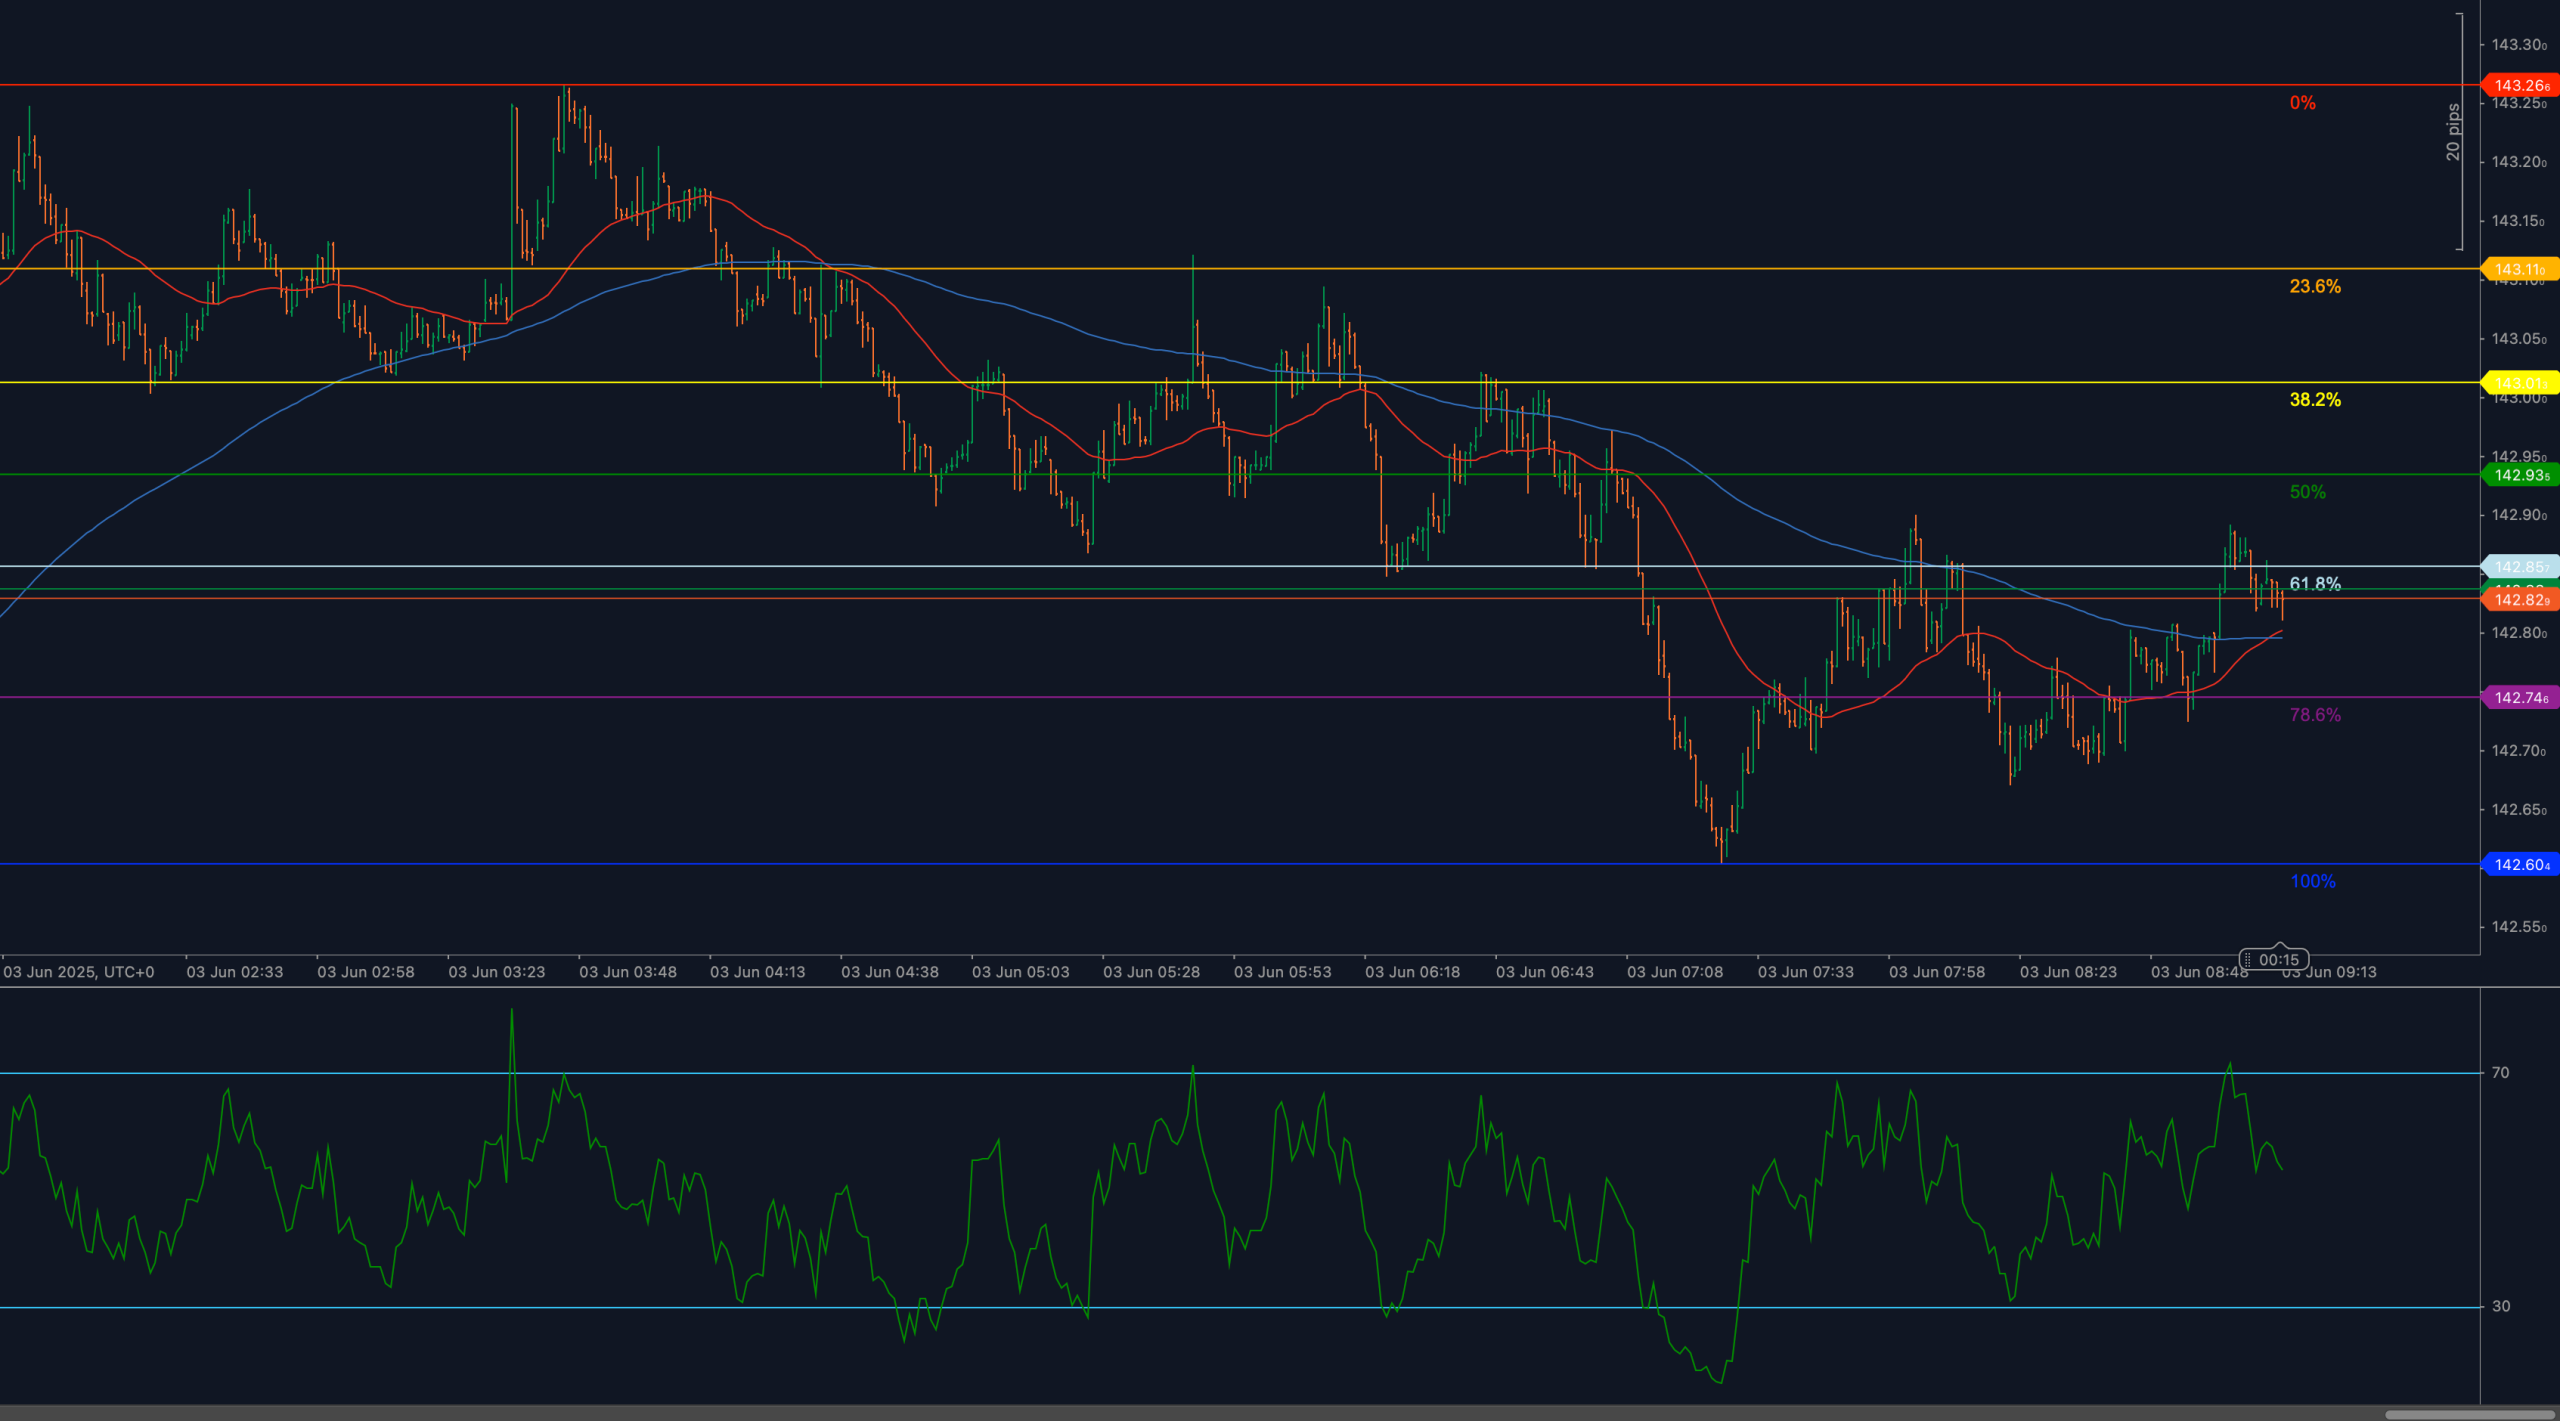
The most immediate resistance lies at 142.88, which marks the 61.8% Fibonacci retracement from the prior drop between 143.26 and 142.60. A clean breakout above this level would suggest a stronger recovery and expose higher resistance at 143.00 and 143.11. The latter represents the 23.6% retracement level and aligns closely with the descending structure that formed throughout May. Above this, the next critical zone is 143.26 — the swing high where the latest decline began. However, upside remains capped unless momentum significantly improves.
On the downside, the first key level to watch is 142.74, the 78.6% retracement of the same leg. A breakdown below this area would put 142.60 — the swing low — back under immediate pressure. If that level gives way, bears may aim for a full retracement and potentially deeper extension targets, especially if momentum accelerates on the breakdown. Additional bearish exposure may unfold toward the mid-142.00s and beyond if trend continuation resumes.
Moving Averages and Dynamic Price Action
Price remains pinned beneath both the 50-period and 200-period weighted moving averages on the intraday chart, with both averages showing a slight downward slope — reinforcing the short-term bearish bias. The 50-WMA is currently converging near 142.90, aligning closely with Fibonacci resistance and adding to its importance as a breakout trigger. Until this confluence zone is reclaimed, upside efforts are likely to be met with selling interest.
The failure to retake dynamic resistance has kept price action contained in a tight range with lower highs and lower closes, indicative of controlled consolidation within a broader downtrend. Should the 50-WMA begin to flatten or point lower with volume confirmation, the signal for trend resumption will strengthen further.
RSI Momentum and Bearish Pressure
The 14-period RSI has failed to sustain any bullish divergence, rolling back from the mid-50s and now hovering just below the 50-neutral mark. This loss of momentum confirms that the rebound lacks sufficient buying pressure to trigger a breakout. RSI readings have been capped since early June, and unless the indicator pushes decisively above 55, momentum remains firmly in favor of the bears.
Should RSI begin to drift below 45–40 while price remains near support, it would confirm a resumption of bearish trend pressure. Only a return above 60 accompanied by rising price would neutralize the current momentum setup.
Candlestick Behavior and Price Action Clarity
The most recent candles have printed indecision near key resistance zones, with several upper wicks forming beneath the 142.88 mark. This signals rejection from the 61.8% Fib and further affirms the presence of supply at this level. The absence of bullish engulfing formations or long-bodied bullish candles indicates that buyers are lacking conviction, and that short-term moves higher are likely corrective rather than impulsive.
If bears retake 142.74 with strong-bodied candles, the likelihood of further downside strengthens. Until candlestick structure prints clear bullish continuation patterns or breakout confirmation, bias remains tilted to the downside.
Chart Structure and Breakdown Formation
Structurally, USD/JPY continues to trade within a descending channel defined by lower highs and lower lows since the late-May reversal. The recovery from 142.60 appears corrective in nature, as price has yet to break previous resistance levels or establish a higher high. This suggests the recent move is more of a pause than a trend reversal.
The lack of impulsiveness in the bounce, combined with tight consolidation near resistance, supports the probability of renewed downside. A confirmed breakdown below 142.60 would reactivate the broader bearish structure and bring into focus key extensions lower.
Fibonacci Retracement and Extension Levels
The current corrective structure in USD/JPY is framed by the Fibonacci retracement drawn from the June 3 high at 143.26 to the swing low at 142.60. Price has retraced up to the 61.8% level at 142.88 but continues to stall beneath it, signaling that bullish momentum remains capped. Just above, the 50% retracement lies at 142.93, followed by the 38.2% mark at 143.00 and the 23.6% level at 143.11 — all forming a cluster of resistance that must be decisively cleared to reestablish upward bias. On the downside, if the pair fails to hold above 142.74 and eventually breaks below 142.60, it would complete the full retracement of the recovery leg and open the door toward deeper bearish extension targets. The next projected support zones would fall around the 1.272 Fibonacci extension near 142.35 and the 1.618 extension at 142.10, which would come into focus if selling accelerates below current range lows.
🔍 MARKET OUTLOOK & TRADING SCENARIOS
Bullish Scenario
Bulls would need a decisive break above 142.88, followed by a reclaim of 143.11, to confirm short-term reversal. This would require RSI pushing above 60 and price breaking the descending channel structure. Targets in this case would include 143.26 and higher, with upside continuation contingent on strong momentum.
Neutral Scenario
Sideways action between 142.74 and 142.88, with RSI ranging between 45 and 55, would indicate consolidation. Traders would likely wait for a breakout from this range before committing to directional bias.
Bearish Scenario
A breakdown below 142.74, especially with RSI rolling under 45, would confirm renewed bearish momentum. A close beneath 142.60 would expose deeper levels, including 142.35 and 142.10, as extension targets.
💼 TRADING CONSIDERATIONS
Bears remain favored below 142.88, especially on rejection candles or failure to reclaim moving averages. Aggressive sellers may enter below 142.74 with tight risk parameters, aiming for breakdown continuation. Bulls must await a decisive breakout and RSI confirmation before considering long setups.
🏁 CONCLUSION
USD/JPY remains trapped below key resistance at 142.88 and continues to consolidate within a broader bearish structure. Momentum indicators point to weakness, and the lack of bullish confirmation supports a downside bias. Unless price reclaims key technical thresholds above 143.11, the risk remains skewed toward further retracement and potential extension below 142.60.
⚠️ DISCLAIMER
This analysis is for informational purposes only and does not constitute financial advice. Always consult with a licensed financial professional before making trading decisions.


