
📊 Market Overview
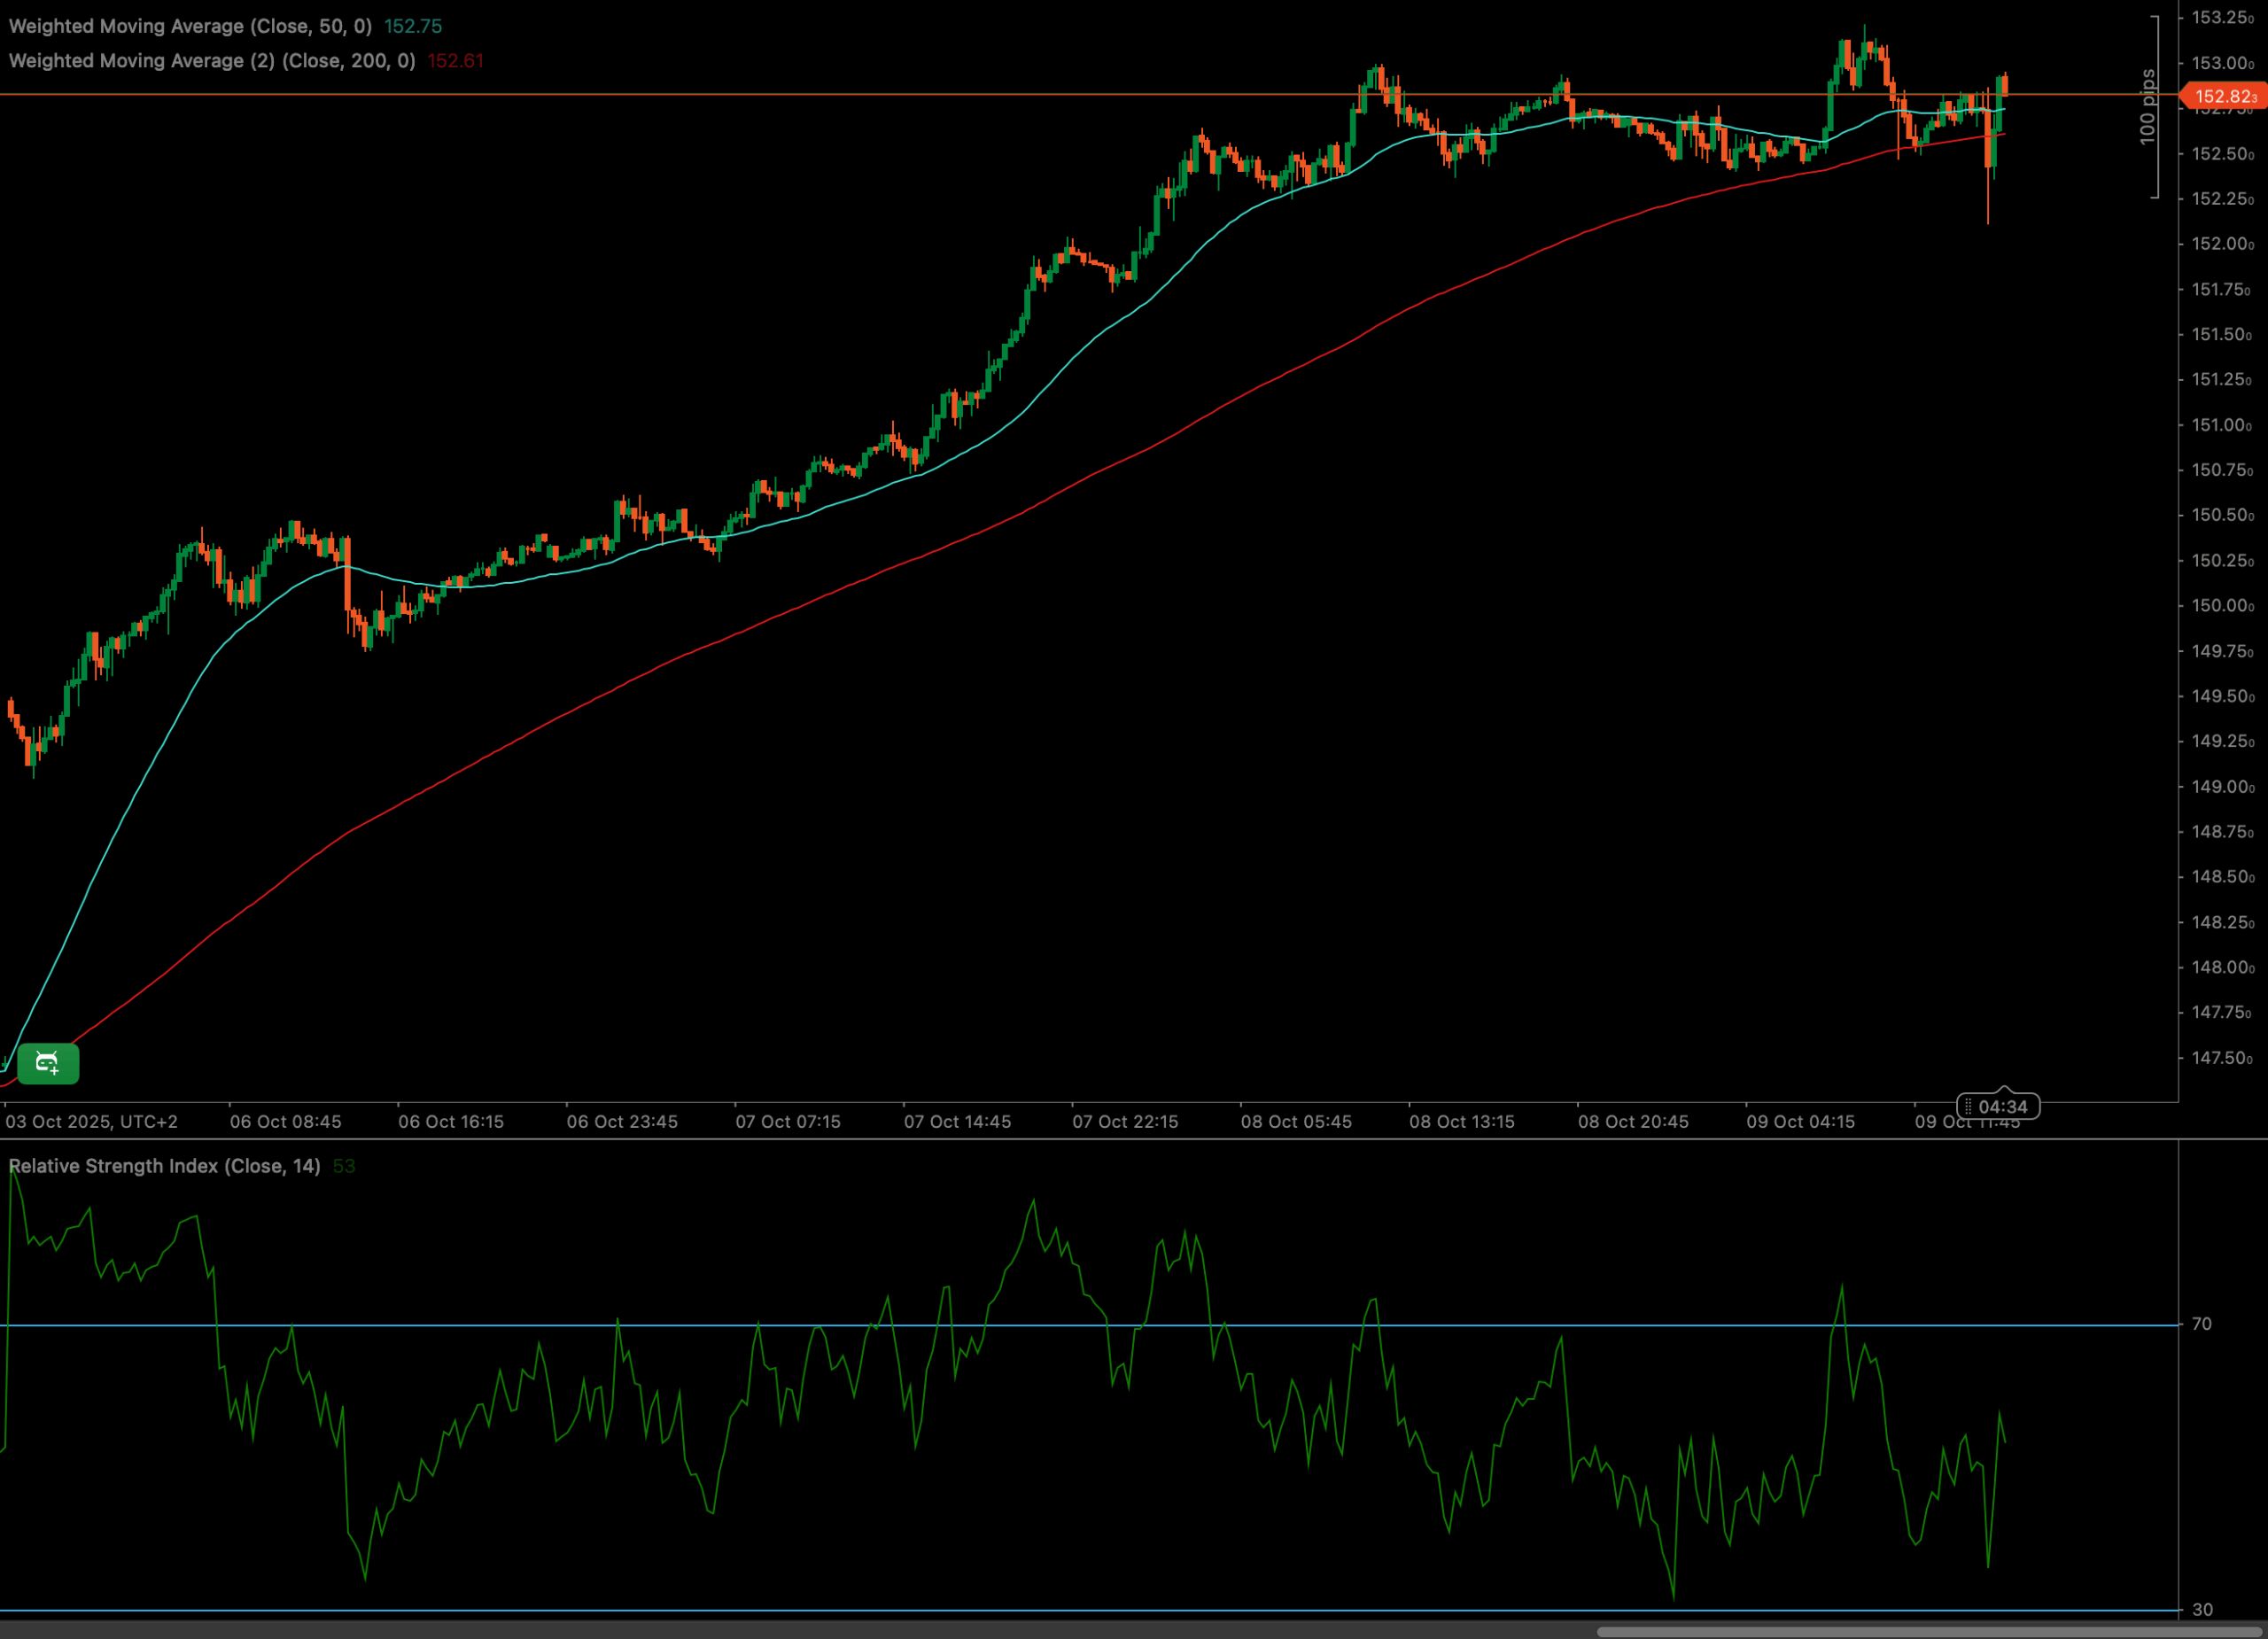
The USDJPY has experienced a consistent uptrend from October 3rd to October 9th, reaching a high near the 153.25 level before showing signs of indecision. The pair now appears to be consolidating near the 152.82 level, which could act as immediate support.
After a sustained climb, the USDJPY faced resistance around the 153.25 mark. This led to a minor pullback, bringing the price closer to the 50-period and 200-period Weighted Moving Averages.
📈 Technical Analysis
Key Support and Resistance Levels
The immediate resistance for the USDJPY is at 153.25, the recent high. On the downside, support can be seen at the 152.82 area and the 50-period WMA. A break below the 50-period WMA could lead to a test of the 200-period WMA.
Moving Average Analysis for USDJPY
Initially, the USDJPY trended strongly upward, maintaining a position above both the 50 WMA (cyan line, at 152.75) and the 200 WMA (red line, at 152.61). The 50 WMA being above the 200 WMA confirmed the bullish trend. The price is now oscillating around the 50 WMA, potentially testing it as support. The 200 WMA remains a key level to watch.
RSI and Momentum Shift in USDJPY
The Relative Strength Index (RSI) has decreased from overbought levels reflecting the recent consolidation. The RSI is currently around 53, having dropped from levels potentially near or above 70. The RSI is neither in overbought nor oversold territory, indicating neutral momentum.
Volume Spike and Market Participation
Volume data isn’t visible in the chart, so confirmation of the recent pullback and consolidation is not possible. An increase in selling volume during the pullback towards the moving averages would suggest continued bearish pressure, while increased buying volume upon reaching the 50 WMA could indicate a potential bounce.
Candlestick Tone and Market Reaction for USDJPY
Recent candlestick patterns suggest indecision near the 153.25 high, followed by a mix of bullish and bearish candles as the price approaches the moving averages. The latest candlesticks are relatively small, indicating consolidation. Watching for breakout patterns above 153.25 or breakdown patterns below the 50 WMA is critical.
🔍 Market Outlook & Trading Scenarios
Bullish Scenario
If the USDJPY holds above the 50 WMA and shows bullish candlestick patterns, a rebound towards the 153.25 high is likely. A sustained break above 153.25 would confirm a continuation of the uptrend.
Neutral Scenario
The USDJPY might consolidate between the 50 WMA and 153.25. This sideways movement could persist until a catalyst drives a breakout or breakdown.
Bearish Scenario
A decisive break below the 50 WMA, especially if confirmed by increased bearish momentum, could lead the USDJPY to test the 200 WMA. A break below the 200 WMA opens the door for further downside.
💼 Trading Considerations
- Bullish setup: Look for bullish candlestick patterns near the 50 WMA or a decisive break above 153.00. Target 153.25 initially.
- Breakout setup: A clear break above 153.25 with increasing volume signals a potential continuation of the uptrend. A breakdown below the 50 WMA could signal a shift to a downtrend.
- Bearish setup: A confirmed breakdown below the 50 WMA, coupled with bearish candlestick patterns, could offer shorting opportunities targeting the 200 WMA.
🏁 Conclusion
The USDJPY is at a decision point, testing the strength of its recent uptrend. The pair’s ability to hold the 50 WMA as support is critical. The RSI, while neutral, suggests caution. Traders should carefully watch price action at these key levels.
A decisive move above 153.25 would signal renewed bullish interest, while a break below the 50 WMA could confirm further downside momentum for the USDJPY.
⚠️ Disclaimer
This analysis is for informational purposes only and does not constitute financial advice. Always consult a licensed financial advisor before making trading decisions.


